This report aims to provide a comprehensive update of all bsdETH related activities over the last quarter, including both on-chain and off-chain data. The purpose of this report is to inform and educate the wider Reserve community on the activities of bsdETH over the last quarter while also being the first in a series of reports which will become a reference library for all governance, social media and on-chain data.
Summary
- Three quarters in, bsdETH shows steady growth across market cap, yield, and staking, but also demonstrates a 10% slide in ETH supply over the later quarter back to levels seen in Q1.
- While there has been no change to the collateral basket in the last 2 quarters, yields are stable dropping only 20 bps from 3.42% to 3.27%.
- Holder and Transfer metrics continue on a healthy growth trajectory.
- Supply across DeFi is a tale with two sides, seeing growth in USD terms but contraction in ETH supply.
- The report now tracks bsdETH supply to index DTFs. Although only a small portion of total supply this metric has the potential to grow significantly with Index DTF adoption.
- There has been no governance activity for bsdETH this quarter.
- Renewed growth of bsdETH social media metrics after a mid-year slump in Q2. Although there is still some room for improvement to get back to Q1 levels.
Question for governors
The flavour of the next quarter for all ETH Yield DTFs is how to expand DeFi supply either through existing or new partnerships, deepening their DeFi compostability. Unlike ETHplus, the venues to supply bsdETH to are limited with only Morpho, Aerodrome, Uniswap available and a handful of Index DTFs with allocations. Where else would you like to see bsdETH supplied, and how would you integrate it?
Full Report
bsdETH Core Metrics and Relative Change
| Metric | Close of Q1 | Close of Q2 | Delta (Q2/Q1) | Close of Q3 | Delta (Q3/Q2) |
|---|---|---|---|---|---|
| Price ($) | $1,634.00 | $2,535.00 | 55.14% | $4,153.00 | 63.83% |
| Price Relative to ETH | 1.03 | 1.03 | 0.00% | 1.04 | 0.97% |
| bsdETH Yield | 2.76% | 3.10% | 12.32% | 3.31% | 6.77% |
| Market Cap ($) | $8,100,000 | $13,000,000 | 60.49% | $18,362,327 | 41.25% |
| ETH Supply | 4,811.00 | 5,149.00 | 7.03% | 4,621.00 | -10.25% |
| Staked RSR ($) | $812,000 | $780,000 | -3.94% | $830,787 | 6.51% |
| Staked RSR ($RSR) | 117,500,000.00 | 114,400,000.00 | -2.64% | 126,610,000.00 | 10.67% |
| Total TVL | $8,912,000 | $13,780,000 | 54.62% | $19,193,114 | 39.28% |
| RSR Backing | 11.00% | 7.00% | -36.36% | 5.00% | -28.57% |
| RSR Staking Yield | 3.70% | 5.80% | 56.76% | 7.60% | 31.03% |
| Diversification Ratio | 67.33% | 67.33% | 0.00% | 67.33% | 0.00% |
Three quarters in, bsdETH shows steady growth across market cap, yield, and staking, with a 10% slide in ETH supply over the later quarter back to the levels seen in Q1.
The tracked core metrics, now with 3 quarters of data, paint a picture of year to date growth across the majority of metrics. Taking a closer look at Q3 in isolation shows a healthy market cap gain of 41.25%, this gain however can be completely attributed to ETH price action given bsdETH price has gained 63.8% and ETH supply has dropped 10.25%. Turning attention to the other side of the coin, RSR staking, we can see positive growth across the board with the amount of RSR staked and its dollar value climbing steadily. It is however possible to infer from this table that the price action of RSR hasn’t been able to match that of ETH as the backing has dropped from 7% to 5%, a 28% decrease.
Current bsdETH Collateral Basket
| Collateral Asset | Allocation | Yield | Basket Yield |
|---|---|---|---|
| wstETH | 33.00% | 2.78% | 0.92% |
| cbETH | 33.00% | 3.27% | 1.08% |
| wsuperOETHb | 33.00% | 3.87% | 1.28% |
| Total Yield Profile | 3.27% | ||
| Diversification Ratio | 67.33% |
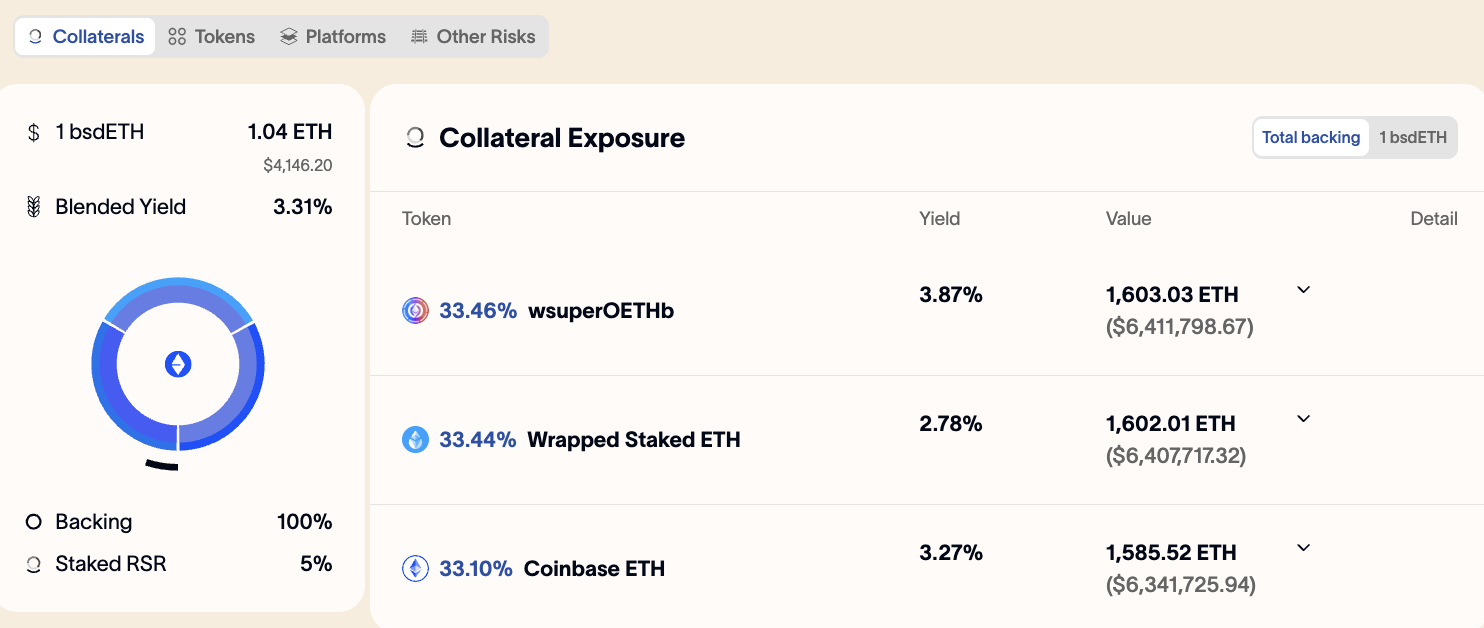
While there has been no change to the collateral basket in the last 2 quarters, yields are stable dropping only 20 bps from 3.42% to 3.27%.
Token Holder and Transfer Metrics
| Metric | Close of Q1 | Close of Q2 | Delta (Q2/Q1) | Close of Q3 | Delta (Q3/Q2) |
|---|---|---|---|---|---|
| Holders | 6,659.00 | 22,086.00 | 231.67% | 23,942.00 | 8.40% |
| Transfers (90d) | 78,764.00 | 244,621.00 | 210.57% | 393,908.00 | 61.03% |
| Total Transfers | 234,407.00 | 463,352.00 | 97.67% | 638,529.00 | 37.81% |
Holder and Transfer metrics continue on a healthy growth trajectory.
Holder and 90d transfers remain positive, growing at 8.4% and 61.3% respectively. While this could be considered a secondary metric given it doesn’t directly correlate with increased adoption of the asset, the increase in holders and 90d traction numbers show the power and increased accessibility the Base L2 provides. For reference ETHplus has 298 holders and ~20,000 transactions and boasts a market cap 10x larger than bsdETH.
DeFi Integrations
| Supply across DeFi Markets | Close of Q1 | Close of Q2 | Delta (Q2/Q1) | Close of Q3 | Delta (Q3/Q2) |
|---|---|---|---|---|---|
| DeFi ($) | $7,800,000 | $11,461,920.00 | 0.4694769231 | $16,501,831.79 | 43.97% |
| DeFi (ETH) | 4,970 | 4,477 | -0.09913229376 | 3,973 | -11.25% |
| Morpho ($) | $6,500,000 | $9,250,000 | 0.4230769231 | $13,920,000 | 50.49% |
| Morpho (ETH) | 3,823 | 3,613 | -0.05485711483 | 3,352 | -7.24% |
| Index DTFs ($) | New Data | New Data | New Data | $256,837 | New Data |
| Index DTFs (ETH) | New Data | New Data | New Data | 62 | New Data |
| Aerodrome ($) | $1,200,000 | $1,932,920 | 0.6107666667 | $1,663,995 | -13.91% |
| Aerodrome (ETH) | 750 | 755 | 0.006729166667 | 401 | -46.93% |
| Uniswap ($) | $240,000 | $279,000 | 0.1625 | $279,000 | 0.00% |
| Uniswap (ETH) | 115 | 109 | -0.05230978261 | 67 | -38.36% |
Supply across DeFi is a tale with two sides, seeing growth in USD terms but contraction in ETH supply.
In dollar terms, bsdETH grew strongly across DeFi, with total supply up 44% and Morpho positions up over 50%. Yet in ETH terms, supply contracted — down 11% overall — as market participants reduced their to bsdETH over the quarter. This duality underscores how ETH price appreciation impacts the metrics and why the north star is and always has been ETH supply.
This section also now sees the supply of bsdETH to index DTFs now being tracked with 62 being supplied in total. As Index DTFs gain traction this number is expected to grow. A key avenue of growth for bsdETH over the coming year is likely to be from the bsdETH supply to Index DTFs given its sticky nature. However, bsdETH has until this point not received an allocation in the largest Index DTF, LCAP, despite it being hosted on Base and having an ETH allocation.
Morpho Markets
| Morpho | Close of Q1 | Close of Q2 | Delta (Q2/Q1) | Close of Q3 | Delta (Q3/Q2) |
|---|---|---|---|---|---|
| bsdETH / WETH | |||||
| Total Supply | $4,900,000 | $7,250,000 | 47.96% | $11,920,000 | 64.41% |
| Total Borrow | $4,200,000 | $6,500,000 | 54.76% | $10,640,000 | 63.69% |
| Available | $740,000 | $750,000 | 1.35% | $1,270,000 | 69.33% |
| Liquidations | $0 | $0 | $0 | ||
| Vaults | |||||
| Seamless WETH | $4,120,000 | $6,660,000 | 61.65% | $9,480,000 | 42.34% |
| Yearn OG WETH | New Allocation | New Allocation | New Allocation | $1,190,000 | New Allocation |
| ClearStar ETH Reactor | New Allocation | New Allocation | New Allocation | $650,310 | New Allocation |
| Gauntlet WETH Core | $818,000 | $537,000 | -34.35% | $602,330 | 12.17% |
| bsdETH / eUSD | |||||
| Total Supply | $1,510,000 | $2,000,000 | 32.45% | $2,000,000 | 0.00% |
| Total Borrow | $566,000 | $1,420,000 | 150.88% | $1,690,000 | 19.01% |
| Available | $994,000 | $580,000 | -41.65% | $287,500 | -50.43% |
| Liquidations | $60,000 | $0 | $0 | ||
| Vaults | |||||
| RE7 eUSD | $1,510,000 | $2,000,000 | 32.45% | $2,000,000 | 0.00% |
Index DTFs
| Index DTF | Market Cap | Allocation Weight | Allocation ($) | Allocation (ETH) |
|---|---|---|---|---|
| Close of Q3 | $0 | 0 | ||
| BCGI | $585,399 | 37.26% | $218,120 | 53 |
| MVTT10F | $361,138 | 10.13% | $36,583 | 9 |
| MVDA25 | $11,961 | 17.84% | $2,134 | 1 |
Aerodrome LP Pairs
| Aerodrome | Close of Q1 | Close of Q2 | Delta (Q2/Q1) | Close of Q3 | Delta (Q3/Q2) |
|---|---|---|---|---|---|
| CL1-WETH/bsdETH (Concentrated Stable) | |||||
| Total TVL | $892,000 | $2,741,000 | 207.29% | $1,616,000 | -41.04% |
| bsdETH | $722,500 | $1,220,000 | 68.86% | $544,000 | -55.41% |
| ETH | $307,700 | $1,600,000 | 419.99% | $1,071,000 | -33.06% |
| vAMM-WETH/bsdETH (Basic volatile) | |||||
| Total TVL | $942,000 | $1,315,000 | 39.60% | $2,145,807 | 63.18% |
| bsdETH | $496,400 | $663,000 | 33.56% | $1,072,000 | 61.69% |
| ETH | $508,300 | $683,000 | 34.37% | $1,072,000 | 56.95% |
| vAMM-RSR/bsdETH (Basic volatile) | |||||
| Total TVL | $75,000 | $95,000 | 26.67% | $88,726 | -6.60% |
| bsdETH | $39,100 | $48,640 | 24.40% | $44,323 | -8.88% |
| RSR | $33,000 | $49,000 | 48.48% | $44,403 | -9.38% |
| vAMM-RSR/bsdETH (Basic volatile) | |||||
| Total TVL (ETH) | $20,000 | $3,000 | -85.00% | $4,471 | 49.03% |
| bsdETH | $18,700 | $1,280 | -93.16% | $3,672 | 186.88% |
| RSR | $1,830 | $1,939 | 5.96% | $800 | -58.74% |
Uniswap LP Pairs
| Uniswap | Close of Q1 | Close of Q2 | Delta (Q2/Q1) | Close of Q3 | Delta (Q3/Q2) |
|---|---|---|---|---|---|
| bsdETH/ETH LP | |||||
| Total TVL | $481,000 | $661,000 | 37.42% | N/A | #VALUE! |
| bsdETH | $195,500 | $279,000 | 42.71% | N/A | #VALUE! |
| ETH | $319,600 | $400,000 | 25.16% | N/A | #VALUE! |
The SubGraph needed to view the Uniswap bsdETH/ETH LP was down during the period in which this report was drafted. To prevent further delays it has been posted without these data points and will be updated in due course.
Governance
No governance activity this quarter.
Social Media
This section looks at the data surrounding the bsdETH X account only
| Social Media Metrics | Close of Q1 | Close of Q2 | Delta (Q2/Q1) | Close of Q3 | Delta (Q3/Q2) |
|---|---|---|---|---|---|
| Posts | 55 | 23 | -58.18% | 29 | 26.09% |
| Impressions | 18,960 | 1,880 | -90.08% | 2,300 | 22.34% |
| Profile Clicks | 256 | 10 | -96.09% | 36 | 260.00% |
| Followers | 147 | 147 | 0.00% | 150 | 2.04% |
Renewed growth of bsdETH social media metrics after a mid-year slump in Q2. Although there is still some room for improvement to get back to Q1 levels.
The activity across bsdETH socials dropped sharply in Q2 and as such became a focus in Q3, showing moderate recovery in the Q3 report. Posts and impressions increased modestly, profile clicks rebounded with a 260% gain, and follower growth resumed, although at a slower pace.
Most Viral Tweet

Conclusion
Q3 marked another quarter of progress for bsdETH, with strong dollar-denominated growth across DeFi, steady staking activity, and a rebound in social traction after a mid-year dip. While ETH supply contracted and RSR backing declined, these metrics highlight duality: scaling in dollar terms while maintaining / sliding ETH supply metrics. Looking ahead, continued integrations and broader adoption will be key drivers of bsdETH’s trajectory into Q4 and beyond.
Once again I’d like to thank the community and the wider Reserve team for their continued support of bsdETH this quarter. Please consider this as an open invitation to anyone thinking about contributing to or have any feedback about the bsdETH strategy to reach out by either under this post or privately.
Finally, if you’ve enjoyed this report and consider me, Ham, a valued steward of the bsdETH Yield DTF please consider delegating your voting power to me to ensure your voice is always represented in Reserve governance. I’m an independent delegate who, since my delegation platform began in July 2025, hasn’t missed a Yield protocol governance vote. You can find more information on my delegation platform.
TG: @hamdefi
Discord: Ham6869