This report aims to be a comprehensive analysis of both ETHplus minting and redemption curves but also its on-chain liquidity and the liquidity of its constituent collateral assets. The purpose of this report is to inform and educate the wider Reserve community, key stakeholders and institutional capital allocators on key liquidity metrics to support governance activities over the next quarter. I plan on completing this analysis quarterly in hopes that it becomes a reference library of key liquidity metrics and how they have changed over time.
A retrospective analysis of Q3 liquidity levels
No formal liquidity report was published at the start of the third quarter, however a liquidity analysis of ETHplus minting and redemption and the liquidity of its constituent collaterals was completed as part of a larger collateral basket change proposal. This analysis will serve as the Q3 Analysis that this report will compare against in lieu of a formal report.
Collateral Liquidity
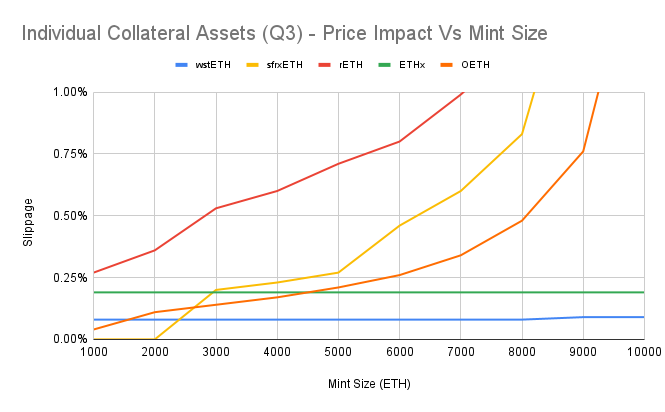
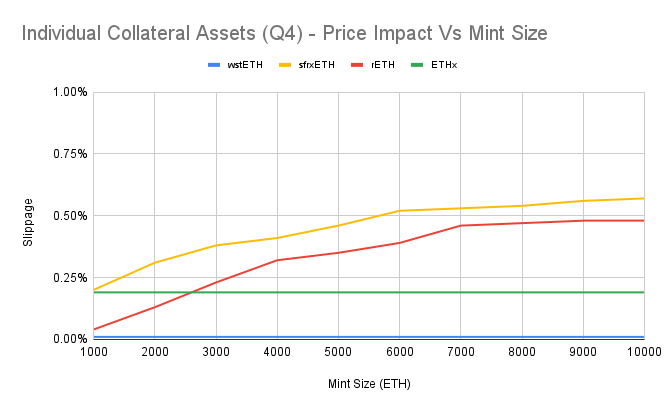
As you can see from the chart below rETH was the most constrained, starting above 0.25% slippage and rising to 0.5% just before 3,000 ETH. sfrxETH performed better hitting 0.25% at 5,000 ETH and 0.5% just after 6,000 ETH. ETHx and wstETH remained below 0.25% through-out the tested range.
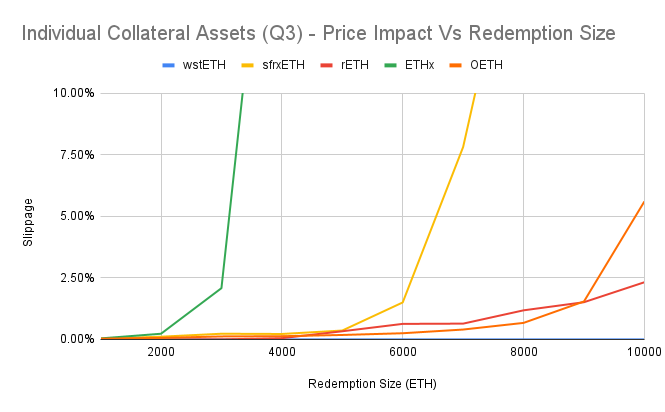
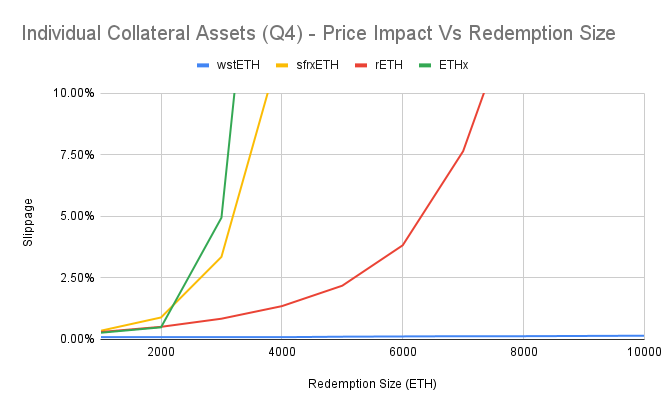
The redemption curves graph paints a different picture with each collateral asset kinking sharply as it’s underlying liquidity bottlenecks. The first of these kinks occurs for ETHx at 2,000 ETH then for sfrxETH at 5,000 ETH, the curves for rETH and wstETH have much flatter redemption curves due to deeper on-chain liquidity.
Q3 Basket
| Collateral Asset | Allocation | Yield | Basket Yield |
|---|---|---|---|
| wstETH | 50.00% | 2.85% | 1.43% |
| rETH | 21.00% | 2.58% | 0.54% |
| sfrxETH | 21.00% | 3.04% | 0.64% |
| ETHx | 8.00% | 2.86% | 0.23% |
| Total Yield Profile | 2.83% | ||
| Diversification Ratio | 0.66 |
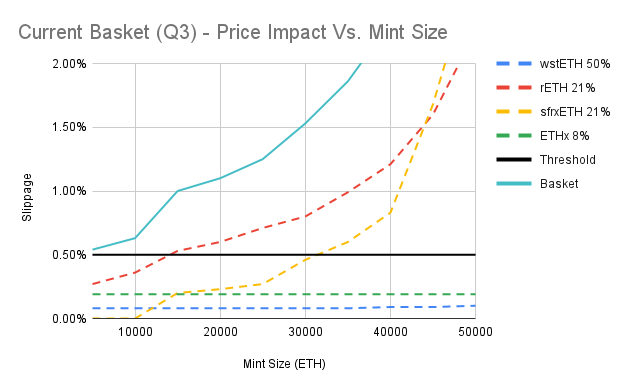
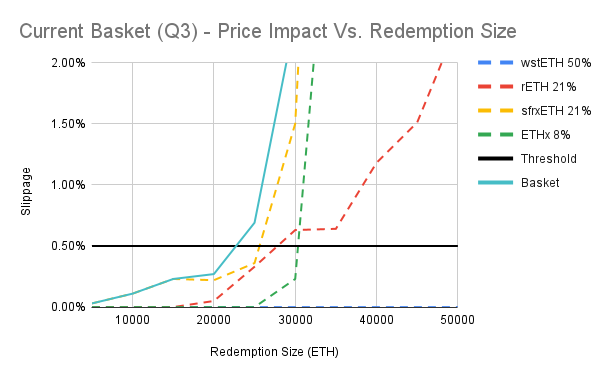
Minting ETHplus was not longer compliant with governors general consensus of 0.5% threshold slippage in Q3. Despite having the most liquid LST collaterals in the basket the aggregate slippage of ETHplus constituent collaterals is high; crossing 0.5% below 10,000 ETH. However, despite high slippage at smaller sizes this curve rises slowly, not crossing 1% until 15,000 ETH and 1.5% at 30,000 ETH.
The redemption curve was more compliant with the threshold slippage, not being crossed until after 22,500 ETH. A notable finding with this graph is the flat blue dotted line of wstETH at the bottom of the Y-axis doesn’t show any signs of kinking even with with a ETHplus redemption totalling 50,000 ETH. The unmatched liquidity of wstETH is one of the reason why it’s allocation remains maxed at 50%.
Overall, the minting and redemption curves seen in Q3 were adequate for the size of the ETHplus and the LST collaterals available. I would have preferred the minting curve to be below threshold slippage until mints above 10,000 ETH but without any new collaterals entering the basket the allocation would have had to be taken from rETH and given to another incumbent. However, the grouping of collateral assets on the redemption graph is tight, allocating to another incumbent that isn’t wstETH would shift the redemption curve right making ETHplus redemptions less efficient. The allocation could be instead given wstETH, improving both the minting and redemption curves but this would increase the wstETH allocation above 50% which a lot of governors would find non-compliant.
Q4 Analysis - Minting and Redemption curves
Collateral liquidity
The Q4 analysis shows a general improvement in the minting curves for collateral assets with the sum slippage for a 5,000 ETH trade totaling 1.01%, compared to 1.53% in Q3, this improvement can mainly be attributed to a more efficient rETH swap with slippage decreasing from 0.71% to 0.35% with a 5,000 ETH swap over the quarter. sfrxETH has now replaced rETH as the collateral with the worst performing minting curve.
A severe degradation in the liquidity supporting collateral asset exits is seen in the Q4 analysis. While our most illiquid asset in the basket, ETHx has maintained the position of it’s curve the redemption curves for sfrxETH and rETH have shifted left towards it.
Current Basket
| Collateral Asset | Allocation | Yield | Basket Yield |
|---|---|---|---|
| wstETH | 50.00% | 2.67% | 1.34% |
| rETH | 21.00% | 2.42% | 0.51% |
| sfrxETH | 21.00% | 3.06% | 0.64% |
| ETHx | 8.00% | 2.72% | 0.22% |
| Total Yield Profile | 2.70% | ||
| Diversification Ratio | 0.66 |
The improvements seen in collateral asset minting translates into a more efficient minting of ETHplus with the minting curve, seen in baby blue, starting below the 0.5% threshold for the first time before slowly rising to 1% at a size of 20,000 ETH and not going above 1.5% within the bounds of the analysis. The minting curve is marked improvement from Q3 as then the curve started above the 0.5% threshold and rose quickly hitting 1.1% at 20,000 and 1.53% at 30,000 ETH.
Unfortunately the same can’t be said for the redemption curve, as expected the severe degradation in the on-chain liquidity of each of the collateral basket assets has impacted ETHplus redemption curve. Where we previously saw a tight grouping of the collateral asset redemption curves around the 25,000 - 30,000 ETH mark we now see divergence with sfrxETH and rETH shifting left dramatically and even wstETH now showing signs of a liquidity crunch, albeit at much larger sizes. It’s worth noting here that since the ETHx redemption curve remained constant during the last quarter it is no longer the collateral asset bottlenecking ETHplus redemptions being overtaken by both rETH and sfrxETH.
Although we have seen an improvement in the minting curve of ETHplus the analysis shows there is still room for optimisation as the ETHplus redemption curve is non-compliant with the 0.5% slippage threshold. The main liquidity bottlenecks during ETHplus redemptions are now sfrxETH and rETH, reducing the allocations to these two assets will shift their redemption curves right and converge them with the other assets in the basket making exiting (and entering) ETHplus positions more efficient. Optimising the basket for liquidity in this way will allow ETHplus to continue to scale and as such should be a primary goal for ETHplus governors over the next quarter.


Q4 Analysis - ETHplus share of Collateral Asset TVL
| Collateral Asset | Total TVL | Basket Allocation | Percentage of Total TVL Held in ETHplus |
|---|---|---|---|
| wstETH | $38b | $200m | 0.53% |
| rETH | $2b | $84m | 4.2% |
| sfrxETH | $500m | $84m | 16.8% |
| ETHx | $675m | $32m | 4.74% |
The percentage share of collateral asset TVL was discussed recently by @akshatmittal when discussing the inclusion of OETH in the collateral basket. With that proposal we would have seen ETHplus hold over 30% of OETH TVL which is concerning not only from a liquidity point of view but also for sheer size and dependence, which is why the proposal didn’t pass it’s on-chain vote.
Since that forum discussion I’ve looked into the percentage of collateral asset TVL ETHplus holds within it’s index and will track this moving forward, there is no set rule for maximum percentage of a collateral assets TVL ETHplus can hold but less than 10% feels appropriate. Setting this parameter loosely off conversations i’ve had with governors, @akshatmittal’s comments and @Sawyer’s previous RToken Plugin Rating System.
With the above in mind we can clearly see that ETHplus is over-allocated to sfrxETH currently holding 16.8% of the total TVL. In my mind this coupled with the fact that sfrxETH is a key contributor to mint and redemption bottlenecks strengthens the case for reducing it’s allocation.
Q4 Analysis - ETHplus on-chain liquidity
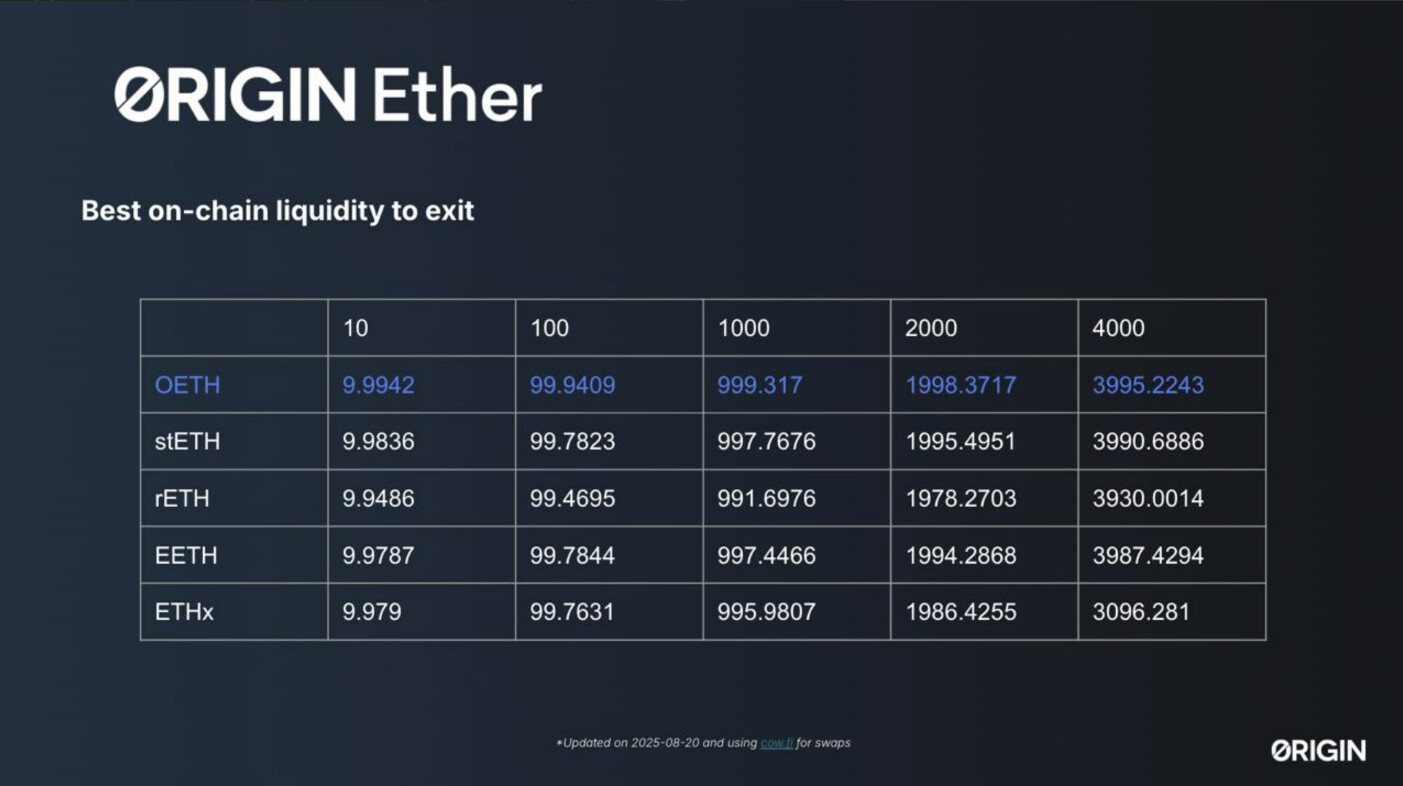
As there are two methods to enter and exit ETHplus, either via a protocol mint or swapping in or out on a DEX via on-chain liquidity, this section provides an in-sight into the latter, less discussed entry and exit via a DEX.
As you can see from the table entering and exiting ETHplus via on-chain liquidity isn’t a viable option for institutional entrants with significant size and is likely only an option for entities looking to enter or exit positions well below 1,00 0 ETH. If anyone is interested in the outcome of operations under 1,000 ETH and the best route to enter / exit ETHplus at these levels please leave a comment down below. I’m more than happy to look into this and post the results in the Q4 liquidity report.

Summary
The Q4 liquidity analysis shows a mixed picture. On the positive side, collateral asset minting curves have improved, with total slippage for a 5,000 ETH trade falling from 1.53% in Q3 to 1.01% in Q4. This has translated into a more efficient ETHplus minting curve, now starting below the 0.5% slippage threshold and remaining under 1.5% for trades past 50,000 ETH. However, redemption liquidity has deteriorated, with sfrxETH and rETH showing significant degradation and even wstETH beginning to show signs of liquidity bottlenecking with ETHplus redemptions over 40,000 ETH. Despite the increased efficiency with minting ETHplus a rebalance is required to address redemptions and ETHplus’s over-exposure to sfrxETH. A rebalance which reduces the allocation to rETH and sfrxETH will shift the ETHplus redemption curve to the right and keep the curve below the redemption curve below the 0.5% threshold for longer will encourage institutional capital allocators to hold ETHplus and support their operations as we scale towards ETHplus’s 9 figure TVL target.
Comments on Data Collection and Methodology
All of the data was collected via Llamaswap using the Odos and Paraswap aggregators, with the best price impact between the two being recorded.
For the price impact Vs mint / redemption size models for the ETHplus collateral basket accurate collateral basket allocations were used rather than an extrapolation of the mint and redemption curves for each collateral asset, ensuring accurate slippage values. The data used to model these graphs and other collateral baskets was collected on 05/09/2025 and can be found here.
Question for Governors
I feel there is a slight inaccuracy in the terminology used in the article. The terms ‘Minting’ and ‘Redemption’ are used for both entering and exiting the collateral assets of ETHplus and ETHplus itself. In practice there is no minting or redemptions occurring when entering or exiting the collateral assets seen as though they are being swapped via DEX LPs. In contrast, the term mint and redemption holds true for ETHplus as the protocol mints new or burns ETHplus tokens when it receives or gives out constituent collaterals.
Is the nomenclature used in this article confusing? Would it be clearer if we pivoted away from ‘Minting and Redemption Curves’ when discussing collateral assets in favour of something more technically correct like ‘Entry and Exit Curves’ while keeping the current terminology for ETHplus? Or are there no issues with the current terminology and what is inferred by it?