Welcome to the Q3 2025 quarterly report for High Yield USD (hyUSD), designed to provide a comprehensive snapshot of the project’s performance and ecosystem developments. This report dives into key metrics, including governance activities across the forums and onchain, TVL(Total Value Locked) trends, critical DeFi metrics, and evolving social media engagement. By presenting these insights, our goal is to keep the hyUSD community well-informed, foster transparency, and encourage active participation in the ongoing growth and success of hyUSD.
Current hyUSD Collateral Basket:
| Collateral Asset | Allocation | Yield |
|---|---|---|
| Aerodrome eUSD/USDC LP | 50% | 5.8% |
| Comp v3 USDC | 25% | 5.3% |
| Aave v3 USDC | 25% | 5.5% |
| hyUSD APY | 4.6% |
Summary: This section highlights the current collateral basket and the yield profile of hyUSD. Quarter over quarter the hyUSD APY has increased from 3.5% to 4.6%, it’s a good sign to see positive growth in this metric. Understanding why this number has increased comes down to the composition of the collateral basket. 50% of the hyUSD collateral basket is composed of the eUSD/USDC LP position on Aerodrome. Last report we talked about how the underlying yield for this position comes in the form of the AERO token, and one factor that drives the APR for this position is ultimately dependent on the AERO price. In quarter 3 we have seen the price of AERO reach as low as $0.67 in early July up to as high as $1.50 in the middle of August. Currently the AERO price sits at $1.15. This increase in the AERO price has had a positive effect on the eUSD/USDC LP position’s APR, which in turn has been reflected in the increase in yield APY for hyUSD.
hyUSD Market Cap, TVL, and Other Core Metrics:
| Metric | Close of Q2 | Close of Q3 | Delta (Q3/Q2) |
|---|---|---|---|
| Price ($) | $1.091 | $1.10 | +0.9% |
| Market Cap ($) | $4,134,931 | $3,100,000 | -28% |
| hyUSD Yield | 3.5% | 4.6% | +27% |
| hyUSD Supply | 3,790,038 | 2,829,000 | -29% |
| Staked RSR ($) | $477,495 | $458,039 | -4.1% |
| Staked RSR (RSR) | 70,219,931 | 65,612,856 | -6% |
| Total TVL | $4,612,426 | $3,558,039 | -25% |
| Overcollateralization (%) | 15% | 18% | +18% |
| RSR Staking Yield | 5.8% | 5.4% | -7.1% |
Summary: The metric to highlight is the decrease in market cap while the underlying yield increases. Not only was the underlying yield higher but the yield opportunities LP’ing hyUSD were also quite attractive throughout most of the quarter. On Beefy finance, the hyUSD-eUSD LP pool was offering up to 15% APY in the middle of August. 15% APY is a very attractive yield offering in crypto and on the higher end of what’s available in crypto right now. At the quarter close these yields dropped significantly and are about equal to what the underlying yield of hyUSD is. The drop in LP yields could potentially be one of the reasons why we saw a decline in the hyUSD market cap at the quarter close. Overall a good quarter to reflect on to see what the yield threshold might need to be in order to see growth in the hyUSD market cap.
DeFi and Onchain Metrics
Transactions and Holders on Base
| Metric | Close of Q2 | Close of Q3 | Delta (Q3/Q2) |
|---|---|---|---|
| Holders | 8,228 | 8,220 | -0.09% |
| Total Transactions | 11,533 | 7,227 | -45% |
Integrations
Morpho
| Morpho Re7 eUSD Vault | Close of Q2 | Close of Q3 | Delta (Q3/Q2) |
|---|---|---|---|
| hyUSD Supplied | $1,970,0000 | $1,730,0000 | -12% |
| Supply Cap | $2,000,000 | $2,000,000 | NA |
| Utilization | 80% | 54% | -38% |
Aerodrome
| hyUSD/eUSD Basic Volatile Pool: | Close of Q2 | Close of Q3 | Delta (Q3/Q2) |
|---|---|---|---|
| hyUSD Supplied | $1,767,665 | $1,200,000 | -38% |
| eUSD Supplied | $1,743,407 | $1,300,00 | -29% |
| Total Pool TVL | $3,509,460 | $2,700,000 | -26% |
Summary: Quarter over quarter we have seen a decline across all metrics in this section. One metric to highlight is the current borrow rate in the hyUSD/eUSD market. Currently the borrow APY is 0.3%, with an average borrow rate for the past 3 months at 1.2% APY. The underlying yield of hyUSD is about 4.6%, making this looping trade extremely profitable.
Governance:
There were no Governance proposals in Q3 for hyUSD on Base.
Social Media
| Social Media | Close of Q2 | Close of Q3 | Delta (Q3/Q2) |
|---|---|---|---|
| Posts | 65 | 48 | -30% |
| Impressions | 17,396 | 15,798 | -9.6% |
| Engagement Rate | 2.6% | 2.3% | -12% |
| Followers | 4622 | 4,585 | -0.8% |
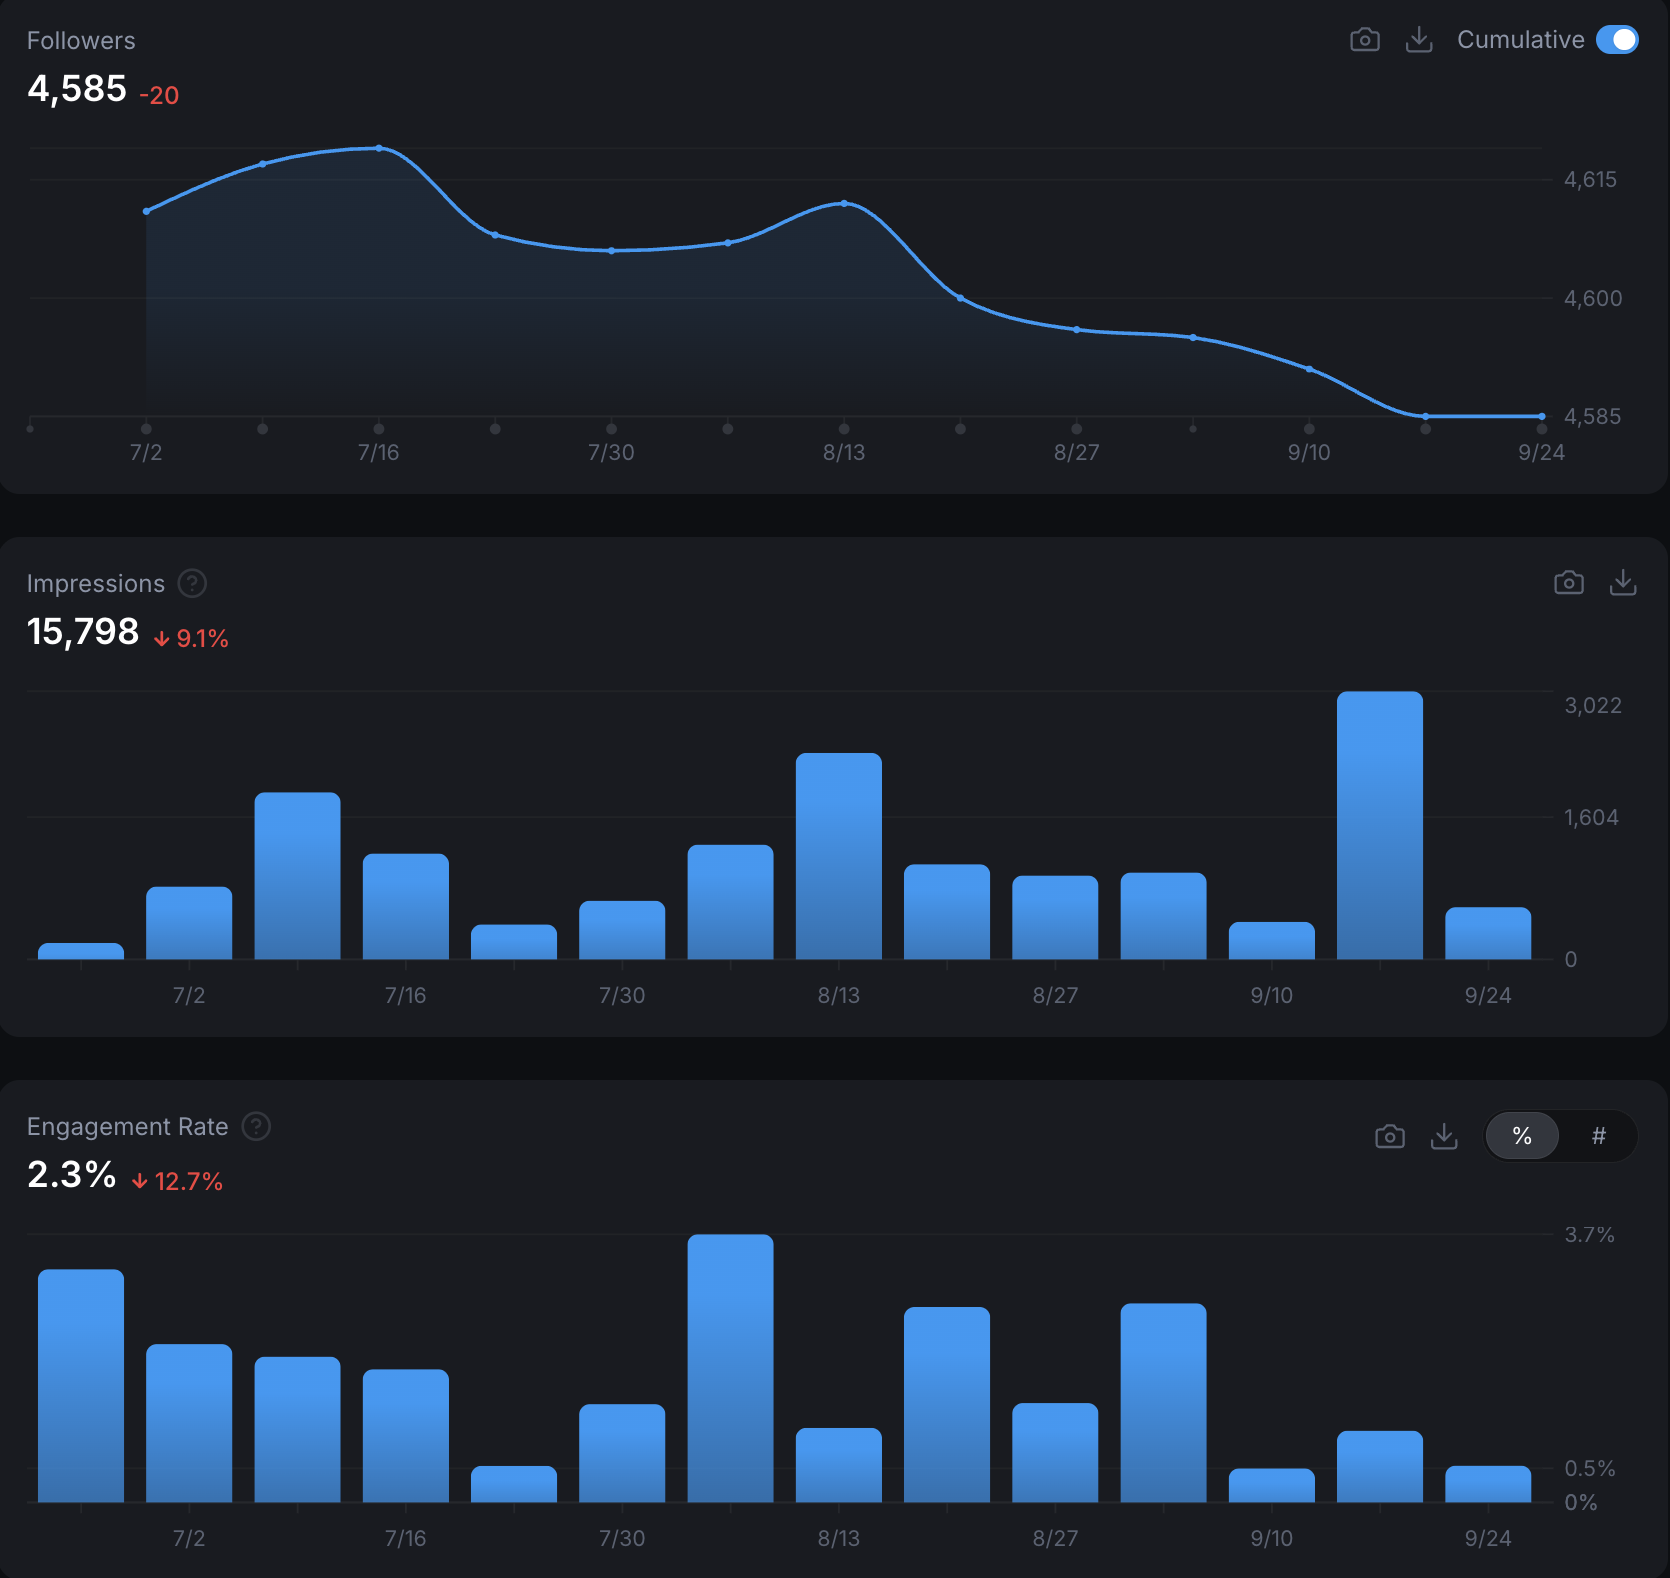
Summary: Each social metric declined quarter over quarter, this would be concerning except for there is one metric that we can derive from the data above that we don’t currently track. If we divide the impressions by the number of posts we get 267 for Q2 and 329 for Q3. This number is a metric for posts per impressions, so in Q2 for every 1 post we made we received 267 impressions(on average). However in Q3 that number jumped to 329 impressions per one post. It’s hard to tell why the impressions per post jumped, but one reason could be that the quality of content has increased.
Conclusion:
That concludes the Q3 2025 report. Comment below any questions and comments you might have and make sure to stay up to date on all things hyUSD by following the X account here:
Disclaimer: This is everything that happened, a celebration of the community and an invitation to participate in the ongoing success of hyUSD. Continue to participate in the gov ops call, continue to participate on the forums and in onchain votes.
hyUSD: created on the Reserve Yield Protocol ![]()
