Welcome to the Q3 2025 quarterly report for Web 3 Dollar (USD3), designed to provide a comprehensive snapshot of the project’s performance and ecosystem developments. This report dives into key metrics, including governance activities across the forums and onchain, TVL(Total Value Locked) trends, critical DeFi metrics, and evolving social media engagement. By presenting these insights, our goal is to keep the USD3 community well-informed, foster transparency, and encourage active participation in the ongoing growth and success of USD3.
Current USD3 Collateral Basket:
| Collateral Asset | Allocation | Yield |
|---|---|---|
| sUSDS (SKY Savings Rate) | 25% | 4.75% |
| Morpho Steakhouse USDC Vault | 25% | 5.41% |
| Comp v3 USDC | 25% | 4.67% |
| Aave v3 USDC | 25% | 4.43% |
| USD3 APY | 4.1% |
Summary: This section highlights the current collateral basket and the yield profile of USD3. The yields across DeFi appear to have bottomed out, this is reflected in the USD3 yield change quarter over quarter. The USD3 yield went from 3.2%(Q2) to 4.1%(Q3). Currently the yield for USD3 is considered to be among the “risk-free” rate in DeFi. The yield is higher than the suppy APY on Aave USDC but lower than the sky savings rate, giving it an excellent yield profile.
USD3 Market Cap, TVL, and Other Core Metrics:
| Metric | Close of Q2 | Close of Q3 | Delta (Q3/Q2) |
|---|---|---|---|
| Price ($) | $1.051 | $1.06 | +0.85% |
| Market Cap ($) | $49,961,851 | $35,331,318 | -34% |
| USD3 Yield | 3.25% | 4.1% | +23% |
| USD3 Supply | 47,402,136 | 33,180,335 | -35% |
| Staked RSR ($) | $4,633,135 | $4,297,904 | -7.5% |
| Staked RSR (RSR) | 681,343,396 | 672,560,000 | -1.2% |
| Total TVL | $54,594,986 | $39,629,222 | -31% |
| Overcollateralization (%) | 11% | 13% | +16% |
| RSR Staking Yield | 4.8% | 4.7% | -2.1% |
Summary: This section looks at the total market cap of USD3 and the TVL accounted for in the Reserve Yield Protocol. Quarter over quarter we have seen a decline in the USD3 market cap however, over the last year we have seen these sorts of contraction and expansion moves in the USD3 market cap. It’s hard to tell what drives these types of moves, but they tend to be very cyclical in nature.
DeFi and Onchain Metrics
Transactions and Holders on Mainnet
| Metric | Close of Q2 | Close of Q3 | Delta (Q3/Q2) |
|---|---|---|---|
| Holders | 89 | 100 | +11% |
| Total Transactions | 939 | 1,573 | +50% |
Integrations
Morpho
| Morpho Gauntlet eUSD Vault | Close of Q2 | Close of Q3 | Delta (Q3/Q2) |
|---|---|---|---|
| USD3 Allocation | $3,500,000 | $3,870,000 | +10% |
| Supply Cap | $3,500,000 | $4,000,000 | +13% |
| Utilization | 91% | 79% | -14% |
Curve
| USD3/scrvUSD Pool | Close of Q2 | Close of Q3 | Delta (Q3/Q2) |
|---|---|---|---|
| USD3 Supplied | $926,718 | $802,261 | -14% |
| scrvUSD Supplied | $878,297 | $874,763 | -0.4% |
| Total Pool TVL | $1,899,565 | $1,790,571 | -5.9% |
| USD3/sUSDe Pool | Close of Q2 | Close of Q3 | Delta (Q3/Q2) |
|---|---|---|---|
| USD3 Supplied | $419,071 | $380,616 | -9.6% |
| sUSDe Supplied | $519,633 | $497,400 | -4.3% |
| Total Pool TVL | $1,053,570 | $1,001,414 | -5% |
| USD3/sUSDS Pool | Close of Q2 | Close of Q3 | Delta (Q3/Q2) |
|---|---|---|---|
| USD3 Supplied | $445,620 | $486,610 | +8.7% |
| sUSDS Supplied | $323,411 | $480,936 | +39% |
| Total Pool TVL | $811,358 | $1,032,501 | +23% |
Summary: The most notable metric quarter over quarter is the USD3 allocation in the Morpho gauntlet eUSD Vault, quarter over quarter it went from 3.5m to 3.87m. Currently the borrow APY(as of writing this report) is 4.2%, and the USD3 APY is 4.1%. It’s unlikely that there is a profitable spread to loop this market, instead there appears to be demand for eUSD with profitable yield opportunities elsewhere throughout DeFi.
Last quarterly report we talked about the recent new addition of the USD3/sUSDS pool. This pool has seen incredible growth over the last quarter.
Governance:
Proposal 1: USD3 Collateral Basket Change Proposal 4
RFC:
Off-chain Poll - 4 votes (4 for / 0 against)
Quorum: 64M RSR
Voter Turnout - 110M (110M for / 0 against)
Unique Voters: 5
Outcome: Proposal Passed
Summary: There was only one proposal this quarter and that was to remove sDAI and add sUSDS. Governors voted to pass this proposal as the sDAI rate had dropped to 2% APY and the sUSDS rate was 4.75% APY. The underlying asset risk stayed the same but governors were able to increase the yield profile of USD3.
Social Media
| Social Media | Close of Q2 | Close of Q3 | Delta (Q3/Q2) |
|---|---|---|---|
| Posts | 70 | 51 | -31% |
| Impressions | 22,101 | 19,939 | -10% |
| Engagement Rate | 2.7% | 1.5% | -57% |
| Followers | 569 | 587 | +3% |
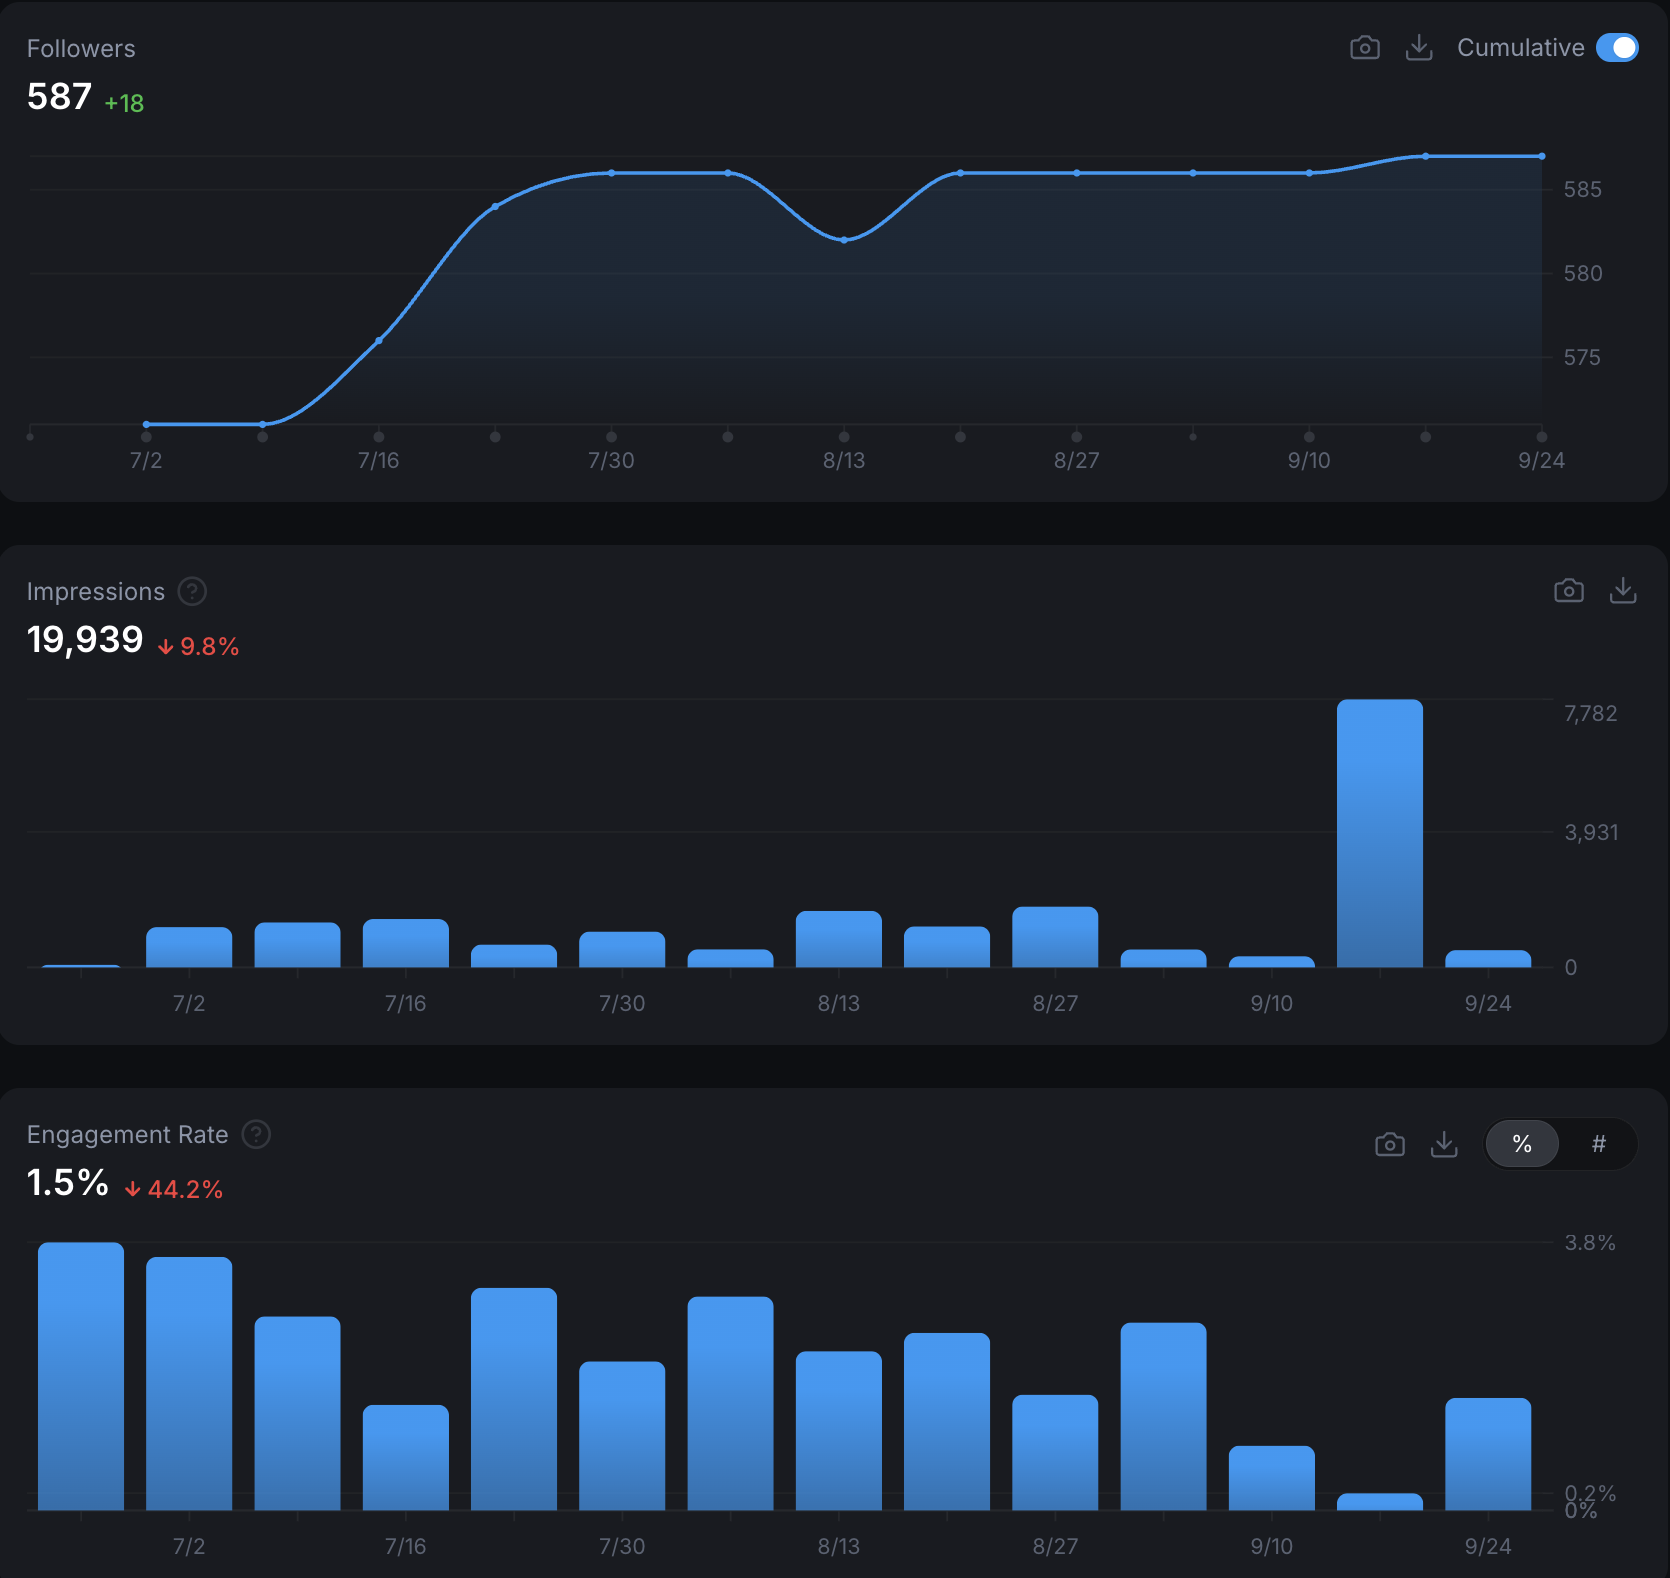
Summary: This quarter we saw a slight decline across most metrics except for the followers. What’s notable about this data set is we saw a more drastic decline in the posts, but the impressions didn’t have such a steep decline. We were able to generate more impressions per post in Q3 then we were able to in Q2. Another positive takeaway from this data set is the followers metric increasing this quarter.
Conclusion:
That concludes the Q3 2025 report. Comment below any questions and comments you might have and make sure to stay up to date on all things USD3 by following the X account here:
Disclaimer: This is everything that happened, a celebration of the community and an invitation to participate in the ongoing success of USD3. Continue to participate in the gov ops call, continue to participate on the forums and in onchain votes.
USD3: created on the Reserve Yield Protocol ![]()
