Welcome to the Q3 2025 quarterly report for The Electronic Dollar (eUSD), designed to provide a comprehensive snapshot of the project’s performance and ecosystem developments. This report dives into key metrics, including governance activities across the forums and onchain, TVL(Total Value Locked) trends, critical DeFi metrics, and evolving social media engagement. By presenting these insights, our goal is to keep the eUSD community well-informed, foster transparency, and encourage active participation in the ongoing growth and success of eUSD.
Current eUSD Collateral Basket:
| Collateral Asset | Allocation | Yield | Underlying Asset TVL Q2 | Underlying Asset TVL Q3 | Delta(Q3/Q2) |
|---|---|---|---|---|---|
| Comp v3 USDT | 33% | 5.25% | $219M | $204M | -7% |
| Comp v3 USDC | 33% | 4.67% | $515M | $518M | +0.5% |
| Aave v3 USDC | 33% | 4.43% | $3.29B | $5.97B | +57% |
| eUSD blended APY | 4.79% |
Note: The eUSD APY is shared to RevShare participants and to RSR stakers.
Summary: This section highlights the current collateral basket and the blended yield APY. It’s important to note that eUSD holders don’t receive any of the underlying yield. The underlying yield is distributed to RevShare participants and to RSR stakers that provide overcollateralization.
In this section we also highlight the TVL of the underlying assets in the collateral basket. The TVL is looking at the total amount supplied in the markets mentioned above. Out of the total supplied we account for 3.7% of the TVL in Comp USDT, 1.4% of the Comp USDC, and 0.12% in Aave USDC. As the eUSD Market Cap continues to grow these will be important metrics to continue to monitor. Another metric to keep an eye on is the available liquidity of the underlying lending market. Currently the least liquid lending market that eUSD is supplying into is the Compound USDT with an available liquidity of 21.8M. With the supply position of $7.7M there is no real concern at this time. However, if eUSD were to see rapid growth and the supply position would exceed the available liquidity of this market then governors would be wise to take action.
eUSD Market Cap, TVL, and Other Core Metrics:
Mainnet:
| Metric | Close of Q2 | Close of Q3 | Delta(Q3/Q2) |
|---|---|---|---|
| Market Cap ($) | $12,204,540 | $13,980,000 | +13.5% |
Base:
| Metric | Close of Q2 | Close of Q3 | Delta(Q3/Q2) |
|---|---|---|---|
| Market Cap ($) | $8,588,380 | $8,973,925 | +4.3% |
Total:
| Metric | Close of Q2 | Close of Q3 | Delta(Q3/Q2) |
|---|---|---|---|
| Market Cap ($) | $22,601,000 | $23,219,661 | +2.7% |
| Staked RSR ($) | $20,727,322 | $16,287,602 | -7.3% |
| Staked RSR (RSR) | 2.55B | 2.55B | NA |
| Overcollateralization (%) | 83% | 72% | -14% |
| RSR Staking Yield | 4.0% | 4.9% | +20% |
| Total TVL | $43,328,322 | $37,011,648 | +15.7% |
Summary: This section looks at the total market cap of eUSD and how it’s split across different networks and accounted for in the Reserve Yield Protocol. Quarter over quarter we saw a growth in eUSD total market cap by about $600K. The other notable metric is the decline in dollar figure of staked RSR on eUSD, this could be attributed to a few users unstaking their RSR on eUSD but it could also be due to the volatility of the underlying price of RSR. Even with the slight decline in the protection of the first loss capital pool, eUSD’s overcollateralization remains sufficient.
DeFi and Onchain Metrics
Transactions on Each Network:
Mainnet:
| Metric | Close of Q2 | Close of Q3 | Delta(Q3/Q2) |
|---|---|---|---|
| Holders | 265 | 314 | +16.9% |
| Total Transactions | 33,762 | 50,858 | +40% |
Base:
| Metric | Close of Q2 | Close of Q3 | Delta(Q3/Q2) |
|---|---|---|---|
| Holders | 23,561 | 23,921 | +1.5% |
| Total Transactions | 54,270 | 59,663 | +9.4% |
Integrations
Morpho
Mainnet:
| Morpho Gauntlet eUSD Core Vault | Close of Q2 | Close of Q3 | Delta(Q3/Q2) |
|---|---|---|---|
| Total Deposits | $7.72M | $7.83M | +1.4% |
Base:
| Morpho Re7 eUSD Vault | Close of Q2 | Close of Q3 | Delta(Q3/Q2) |
|---|---|---|---|
| Total Deposits | $6.98M | $5.86M | -17.4% |
Curve
Mainnet:
| TriRSR Pool | Close of Q2 | Close of Q3 | Delta(Q3/Q2) |
|---|---|---|---|
| RSR | 199M | 257M | +25% |
| eUSD | $1,548,803 | $1,675,712 | +7.8% |
| ETH+ | 499 | 352 | -34% |
| Total Pool TVL | $4.6M | $5M | +8.3% |
| eUSD/USDC Pool | Close of Q2 | Close of Q3 | Delta(Q3/Q2) |
|---|---|---|---|
| eUSD | $4.7M | $2.6M | -57% |
| USDC | $6.0M | $2.5M | -82% |
| Total Pool TVL | $10.7M | $5.2M | -69% |
Aerodrome(Base):
| USDC/eUSD Concentrated Stable | Close of Q2 | Close of Q3 | Delta(Q3/Q2) |
|---|---|---|---|
| eUSD | $1.8M | $71K | -185% |
| USDC | $1.1M | $1.3M | +16% |
| Total Pool TVL | $2.9M | $1.4M | -69% |
| USDC/eUSD Basic Stable | Close of Q2 | Close of Q3 | Delta(Q3/Q2) |
|---|---|---|---|
| eUSD | $1.1M | $698K | -44% |
| USDC | $1.02M | $766K | -29% |
| Total Pool TVL | 2.1M | $1.4M | -40% |
| hyUSD/eUSD Basic Stable | Close of Q2 | Close of Q3 | Delta(Q3/Q2) |
|---|---|---|---|
| eUSD | $1.8M | $1.3M | -32% |
| hyUSD | $1.6M | $1.2M | -28% |
| Total Pool TVL | $3.6M | $2.7M | -28% |
Summary: Last report we talked about Reserve’s participation in the Curve Wars and the plan to incentive onchain liquidity, however this quarter we’ve seen a decline in every pool that Reserve is incentivizing. The one pool that we’ve seen an increase in TVL has been the TriRSR pool, which is the only pool where incentives are not going. The decline in TVL could potentially be due to the August 2025 reduction in CRV emissions which occurred automatically and did not require a community vote.
Governance:
Proposal: [IP] eUSD FinTech Revenue Share Updates x 6
Outcomes: All Proposals Passed
Summary: Overall governors were extremely efficient this quarter. There were 6 Fintech RevShare update proposals and they all passed and hit quorum.
Fintech Revenue Share
eUSD Holdings
| FinTech | Close of Q2 | Close of Q3 | Delta(Q3/Q2) |
|---|---|---|---|
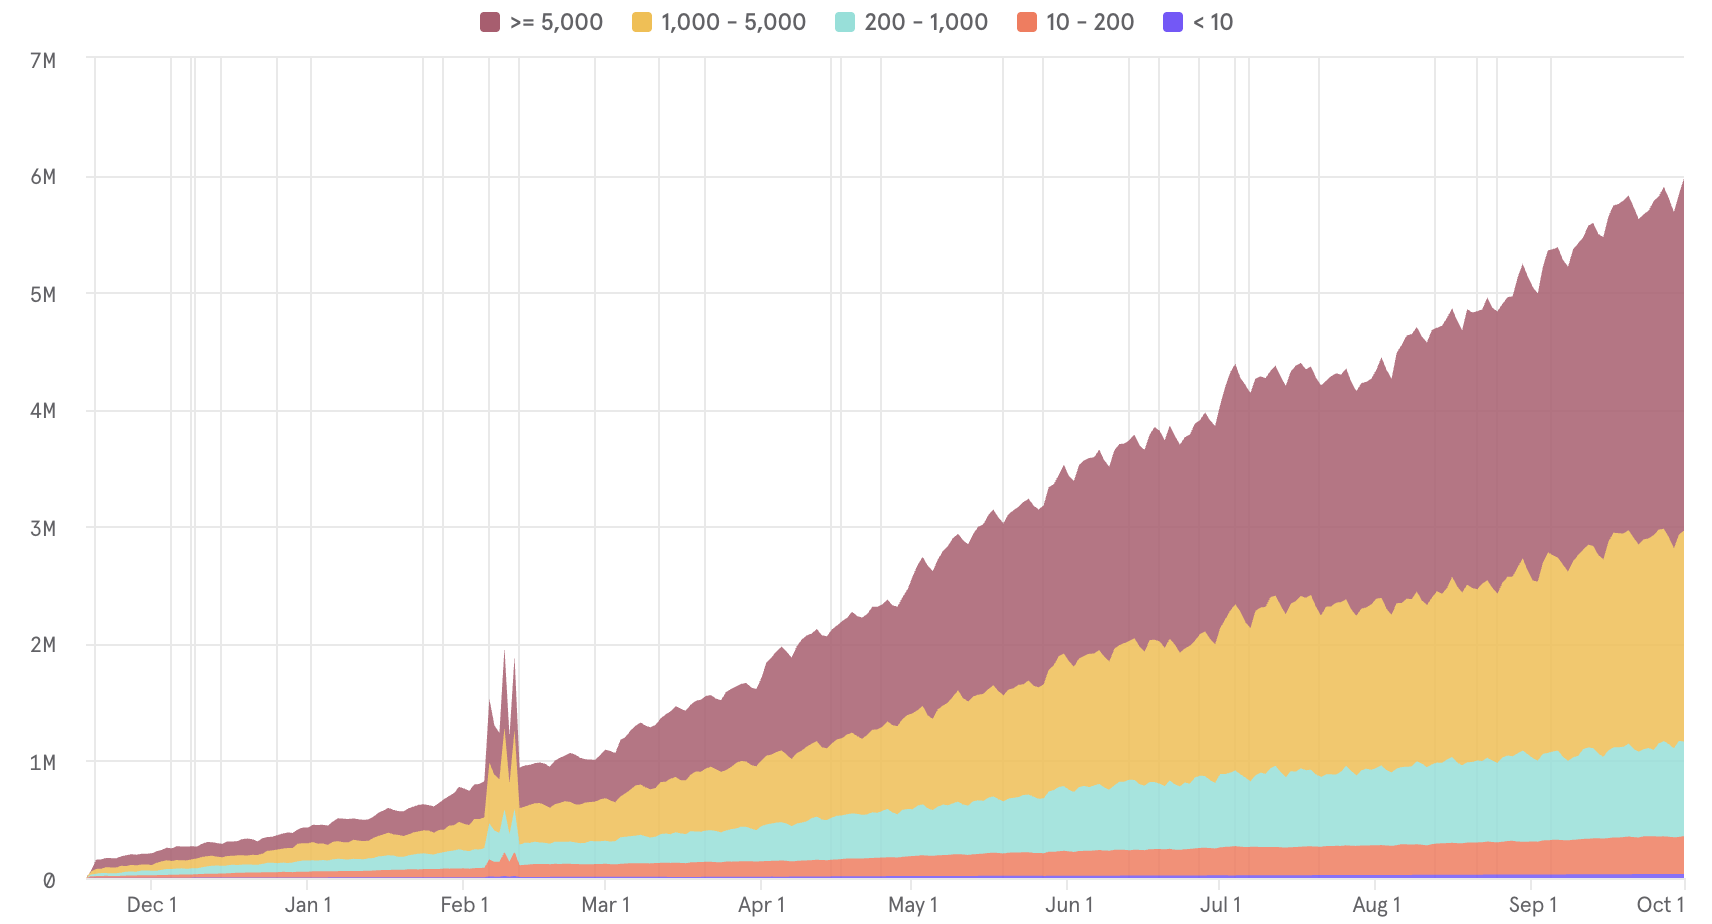
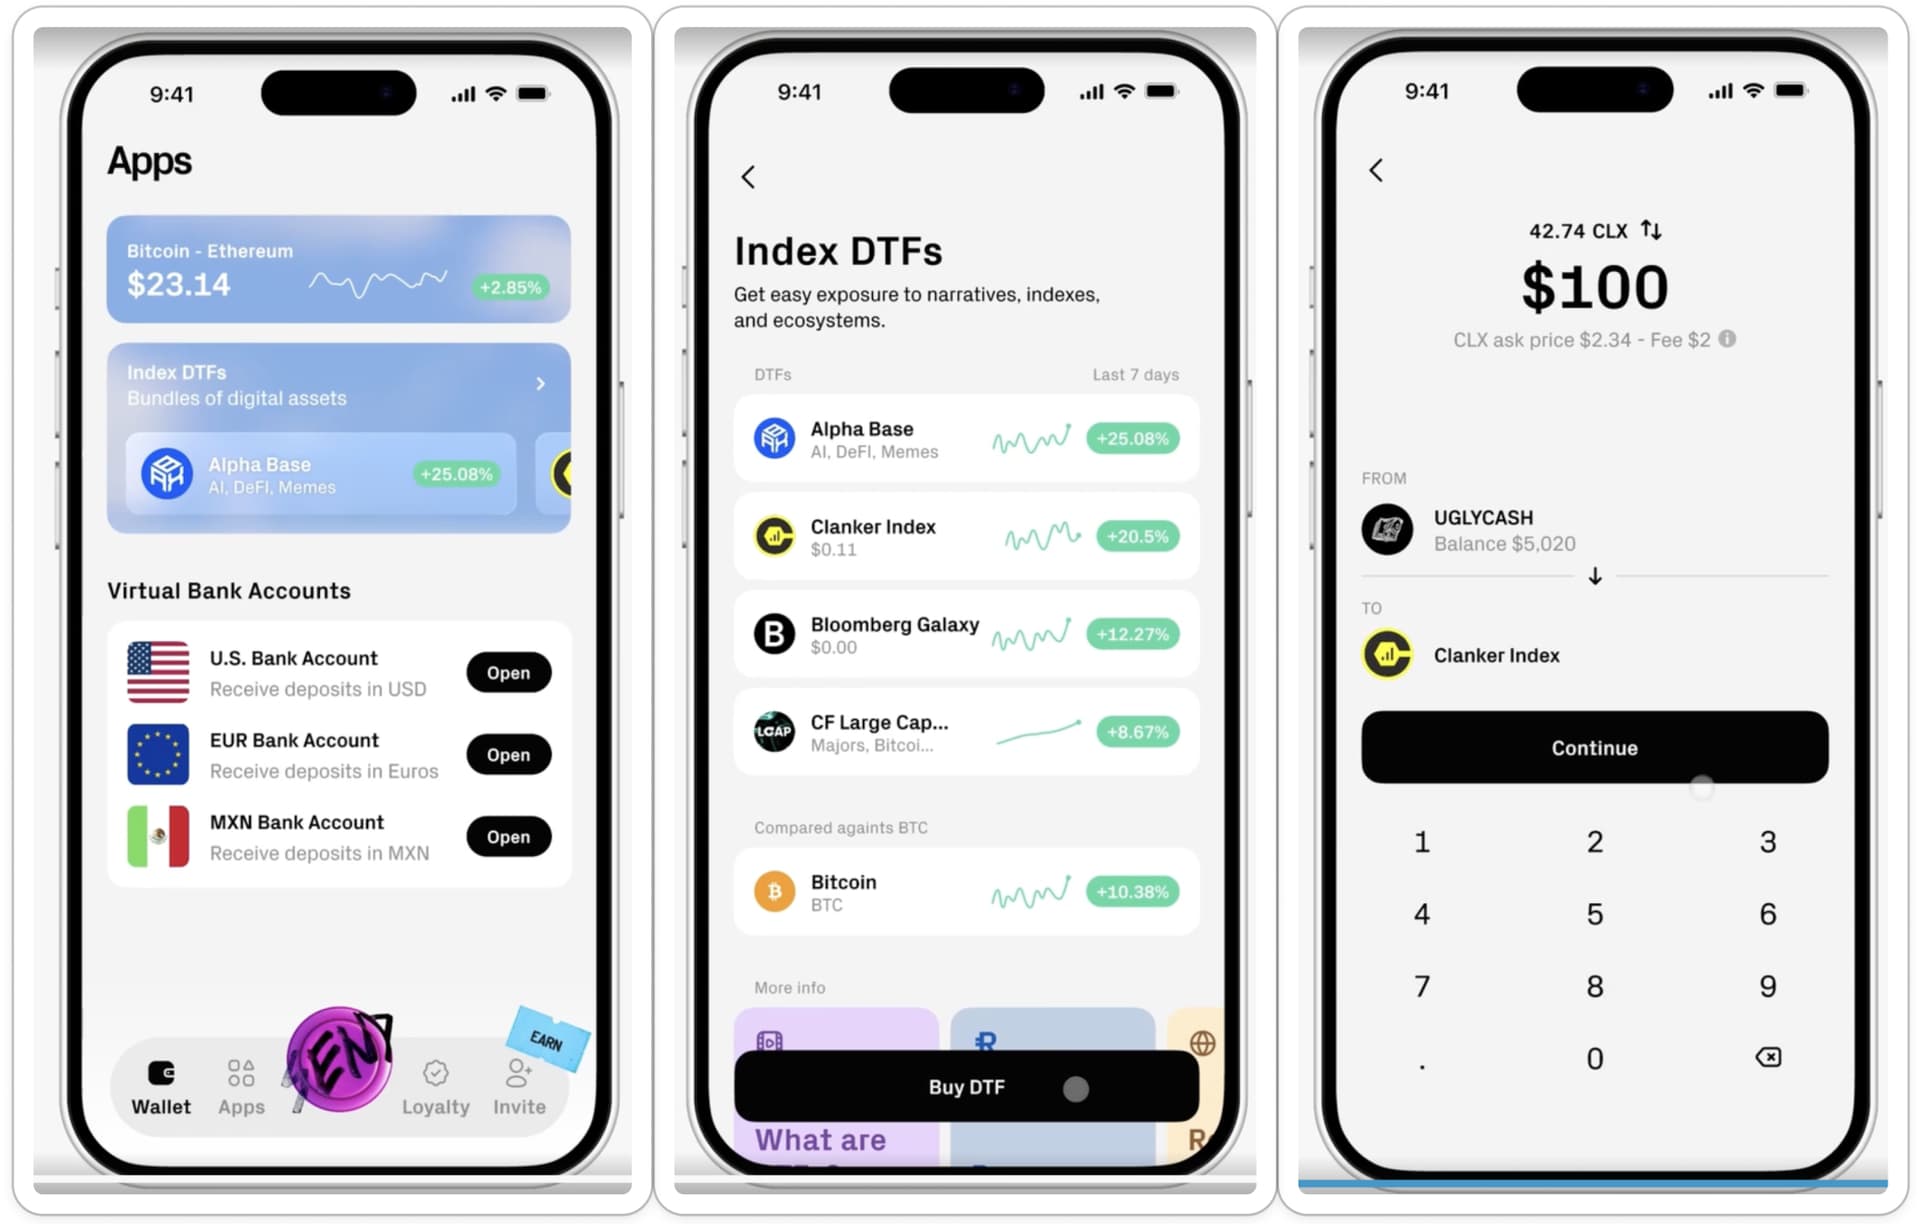
| UglyCash | $3,391,479 | $5,313,364 | +44% |
| Sentz | $1,103,054 | $1,116,676 | +1.2% |
Summary: The FinTech RevShare program is an ongoing proposal of sharing some of the underlying eUSD Revenue with FinTechs who use and promote eUSD for their customers. Quarter over quarter we’ve seen UglyCash grow significantly and they surpassed 5m of assets under custody which are held in eUSD. Another big milestone that happened this quarter for UglyCash is hitting $50,000,000 in total payment volume in 3 months.
Read More about the Original FinTech RevShare Program here:
Social Media
| Social Media | Close of Q2 | Close of Q3 | Delta (Q3/Q2) |
|---|---|---|---|
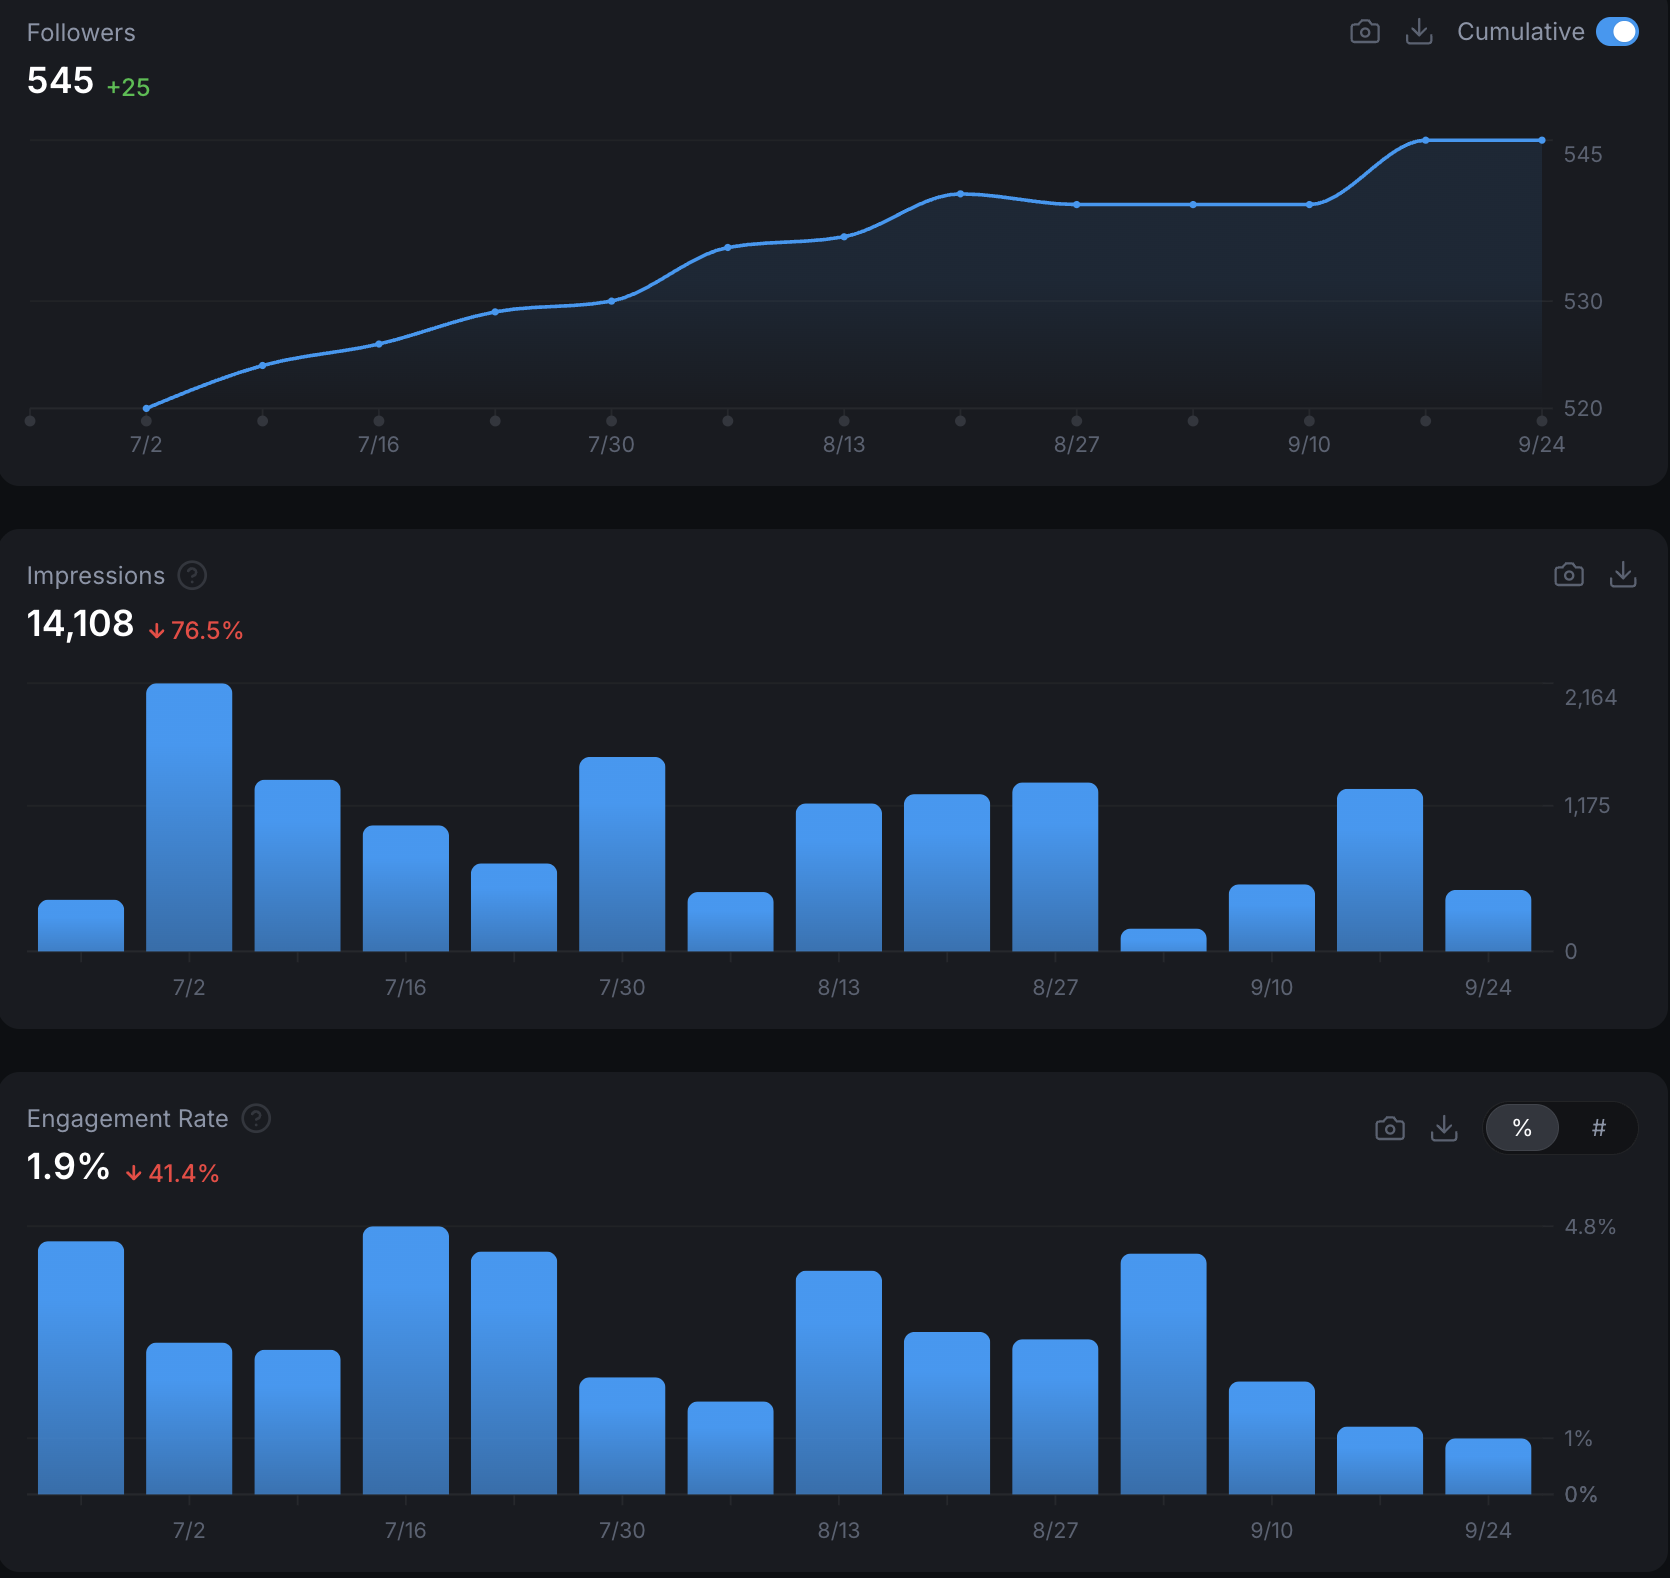
| Posts | 87 | 54 | -46% |
| Impressions | 60,042 | 14,108 | -76% |
| Engagement Rate | 3.4% | 1.9% | -41% |
| Followers | 517 | 545 | +13% |
**
Summary**: This quarter saw a steep decline across most metrics with the exception of followers. The main concern with this data set is the drop in engagement rate. The engagement rate is the key metric that we look to try and improve/maintain. The drop in engagement rate is not as concerning since we’ve seen an increase in the followers. Moving onto the decline in impressions, there is one main reason behind this drop, and that’s the lack of organic retweets we saw from other more established accounts. There is little we can do to control this, but overall there is some work to be done to try and improve these numbers across the board for next quarter.
Conclusion:
That concludes the Q3 2025 report. Comment below any questions and comments you might have and make sure to stay up to date on all things eUSD by following the X account here:
Disclaimer: This is everything that happened, a celebration of the community and an invitation to participate in the ongoing success of eUSD. Continue to participate in the gov ops call, continue to participate on the forums and in onchain votes.
eUSD: created on the Reserve Yield Protocol ![]()