Welcome to the Q2 2025 quarterly report for The Electronic Dollar (eUSD), designed to provide a comprehensive snapshot of the project’s performance and ecosystem developments. This report dives into key metrics, including governance activities across the forums and onchain, TVL(Total Value Locked) trends, critical DeFi metrics, and evolving social media engagement. By presenting these insights, our goal is to keep the eUSD community well-informed, foster transparency, and encourage active participation in the ongoing growth and success of eUSD.
Current eUSD Collateral Basket:
| Collateral Asset | Allocation | Yield | Underlying Asset TVL Q1 | Underlying Asset TVL Q2 | Delta(Q2/Q1) |
|---|---|---|---|---|---|
| Comp v3 USDT | 33% | 4.28% | NA | $219M | NA |
| Comp v3 USDC | 33% | 4.36% | NA | $515M | NA |
| Aave v3 USDC | 33% | 3.81% | NA | $3.29B | NA |
| eUSD blended APY | 4.15% |
Note: The eUSD APY is shared to RevShare participants and to RSR stakers.
Summary: This section highlights the current collateral basket and the blended yield APY. It’s important to note that eUSD holders don’t receive any of the underlying yield. The underlying yield is distributed to RevShare participants and to RSR stakers that provide overcollateralization. In this section we also highlight the TVL of the underlying assets in the collateral basket. The TVL is looking at the total amount supplied in the markets mentioned above. Out of the total supplied we account for 3.6% of the TVL in Comp USDT, 1.5% of the Comp USDC, and 0.24% in Aave USDC. As the eUSD Market Cap continues to grow these will be important metrics to continue to monitor.
eUSD Market Cap, TVL, and Other Core Metrics:
Mainnet:
| Metric | Close of Q1 | Close of Q2 | Delta (Q2/Q1) |
|---|---|---|---|
| Market Cap ($) | $24,100,000 | $22,601,000 | -6.2% |
Base:
| Metric | Close of Q1 | Close of Q2 | Delta (Q2/Q1) |
|---|---|---|---|
| Market Cap ($) | $7,710,000 | $10,711,711 | +38% |
Arbitrum:
| Metric | Close of Q1 | Close of Q2 | Delta (Q2/Q1) |
|---|---|---|---|
| Market Cap ($) | $1,170,000 | $1,470,000 | +25% |
Total:
| Metric | Close of Q1 | Close of Q2 | Delta (Q2/Q1) |
|---|---|---|---|
| Market Cap ($) | $24,100,000 | $22,601,000 | -6.2% |
| Staked RSR ($) | $22,368,327 | $20,727,322 | -7.3% |
| Staked RSR (RSR) | 2.75B | 2.55B | -7.2% |
| Overcollateralization (%) | 84% | 83% | -1.2% |
| RSR Staking Yield | 4.6% | 4.0% | -13% |
| Total TVL | $46,468,327 | $43,328,322 | -6.7% |
Summary: This section looks at the total market cap of eUSD and how it’s split across different networks and accounted for in the Reserve Yield Protocol. Even though there was a slight decline in Total Market Cap and other relevant metrics surrounding eUSD, the biggest takeaway is seeing the growth of eUSD across L2’s. The Ugly Cash wallets that are public on Base are continuing to grow week over week, this is part of the reason that we are seeing positive quarterly growth on Base.
DeFi and Onchain Metrics
Transactions on Each Network:
Mainnet:
| Metric | Q1 | Q2 | Delta (Q2/Q1) |
|---|---|---|---|
| Holders | NA | 265 | NA |
| Total Transactions | 30,772 | 33,762 | +9.71% |
Base:
| Metric | Q1 | Q2 | Delta (Q2/Q1) |
|---|---|---|---|
| Holders | NA | 23,561 | NA |
| Total Transactions | 64,142 | 54,270 | -15% |
Arbitrum:
| Metric | Q1 | Q2 | Delta (Q2/Q1) |
|---|---|---|---|
| Holders | NA | 395 | NA |
| Total Transactions | 2,554 | 2,355 | -7.7% |
Integrations
Morpho
Mainnet:
| Morpho Gauntlet eUSD Core Vault | Close of Q1 | Close of Q2 | Delta (Q2/Q1) |
|---|---|---|---|
| Total Deposits | $8.75M | $11.4M | +30.2% |
Base:
| Morpho Re7 eUSD Vault | Close of Q1 | Close of Q2 | Delta (Q2/Q1) |
|---|---|---|---|
| Total Deposits | $7.61M | $8.86M | +16.4% |
Curve
Mainnet:
| TriRSR Pool | Close of Q1 | Close of Q2 | Delta (Q2/Q1) |
|---|---|---|---|
| RSR | 177M | 199M | +12% |
| eUSD | $1,200,000 | $1,548,803 | +29% |
| ETH+ | 673 | 499 | -25% |
| Total Pool TVL | $3.8M | $4.6M | +21% |
| eUSD/USDC Pool | Close of Q1 | Close of Q2 | Delta (Q2/Q1) |
|---|---|---|---|
| eUSD | $3.9M | $4.7M | +20% |
| USDC | $3.6M | 6.0M | +66% |
| Total Pool TVL | $7.5M | $10.7M | +42% |
Arbitrum:
| eUSD/USDC Pool | Close of Q1 | Close of Q2 | Delta (Q2/Q1) |
|---|---|---|---|
| eUSD | $709K | $988K | +39% |
| USDC | $344K | $564K | +69% |
| Total Pool TVL | $1.05M | $1.54M | +46% |
| KNOX/eUSD Pool | Close of Q1 | Close of Q2 | Delta (Q2/Q1) |
|---|---|---|---|
| eUSD | $425K | $406K | -4.4% |
| KNOX | $267K | $230K | -13% |
| Total Pool TVL | $703K | $650K | -7.5% |
Aerodrome(Base):
| USDC/eUSD Concentrated Stable | Close of Q1 | Close of Q2 | Delta (Q2/Q1) |
|---|---|---|---|
| eUSD | $891K | $1.8M | +102% |
| USDC | $976K | $1.1M | +13% |
| Total Pool TVL | $1.8M | $2.9M | +61% |
| USDC/eUSD Basic Stable | Close of Q1 | Close of Q2 | Delta (Q2/Q1) |
|---|---|---|---|
| eUSD | $1.1M | $1.1M | NA |
| USDC | $898K | $1.02M | +14% |
| Total Pool TVL | $2.01M | 2.1M | +4.4% |
| hyUSD/eUSD Basic Stable | Close of Q1 | Close of Q2 | Delta (Q2/Q1) |
|---|---|---|---|
| eUSD | $1.8M | $1.7M | -5.5% |
| hyUSD | $1.6M | $1.7M | +6.2% |
| Total Pool TVL | $3.6M | $3.4M | -5.5% |
Summary: Back in November of 2022 Reserve Announced their participation in the Curve Wars, shortly after announcing an allocation of $20M of their treasury to purchase Curve governance ecosystems tokens. Their latest public announcement of a $2.2M purchase(part of the ongoing $20M investment) gave the Reserve ecosystem the most voting power of any non-founder entity in the Curve DAO. This investment was to increase the protocols ability to incentivize onchain RToken liquidity.
There’s a clear ongoing trend among these metrics, and that is the increase in TVL across the DeFi landscape in both DEX’s and lending markets quarter over quarter. This is in part due to the strategy and execution behind acquiring governance power and participating in the Curve Wars.
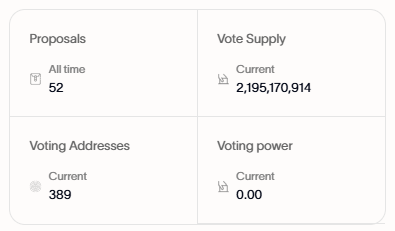
Governance:
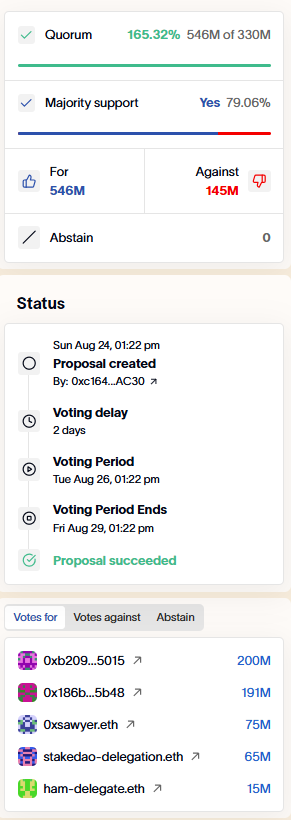
Proposal 1: eUSD Unregister Unused Assets #2
Views: 100
Off-chain Poll - 4 votes (4 for / 0 against)
Onchain Poll:
Quorum: 354M RSR
Voter Turnout - 535M (535M for / 0 against)
Unique Voters: 4
Outcome: Proposal Passed
Summary: Overall governors were extremely efficient this quarter. There were 8 total proposals, and they all hit quorum and passed. Governors had 7 Fintech RevShare update proposals and the 1 proposal to Unregister Unused Assets which made eUSD more gas efficient.
Fintech Revenue Share
eUSD Holdings
| FinTech | Close of Q1 | Close of Q2 | Delta (Q2/Q1) |
|---|---|---|---|
| UglyCash | $1,651,972 | $3,391,479 | +105% |
| Sentz | $1,091,049 | $1,103,054 | +1.1% |
Summary: This quarter Governors had 7 Fintech RevShare update proposals and they all passed and hit quorum. The FinTech RevShare program is an ongoing proposal of sharing some of the eUSD Revenue with FinTechs. eUSD shares underlying revenue with distribution partners(i.e. fintech apps) who use and promote eUSD for their customers.
Read More about the Original Proposal here:
Social Media
| Social Media | Close of Q1 | Close of Q2 | Delta (Q2/Q1) |
|---|---|---|---|
| Posts | 92 | 87 | -5.4% |
| Impressions | 92,000 | 60,042 | -35% |
| Engagement Rate | 4.1% | 3.4% | -14% |
| Followers | 456 | 517 | +13% |
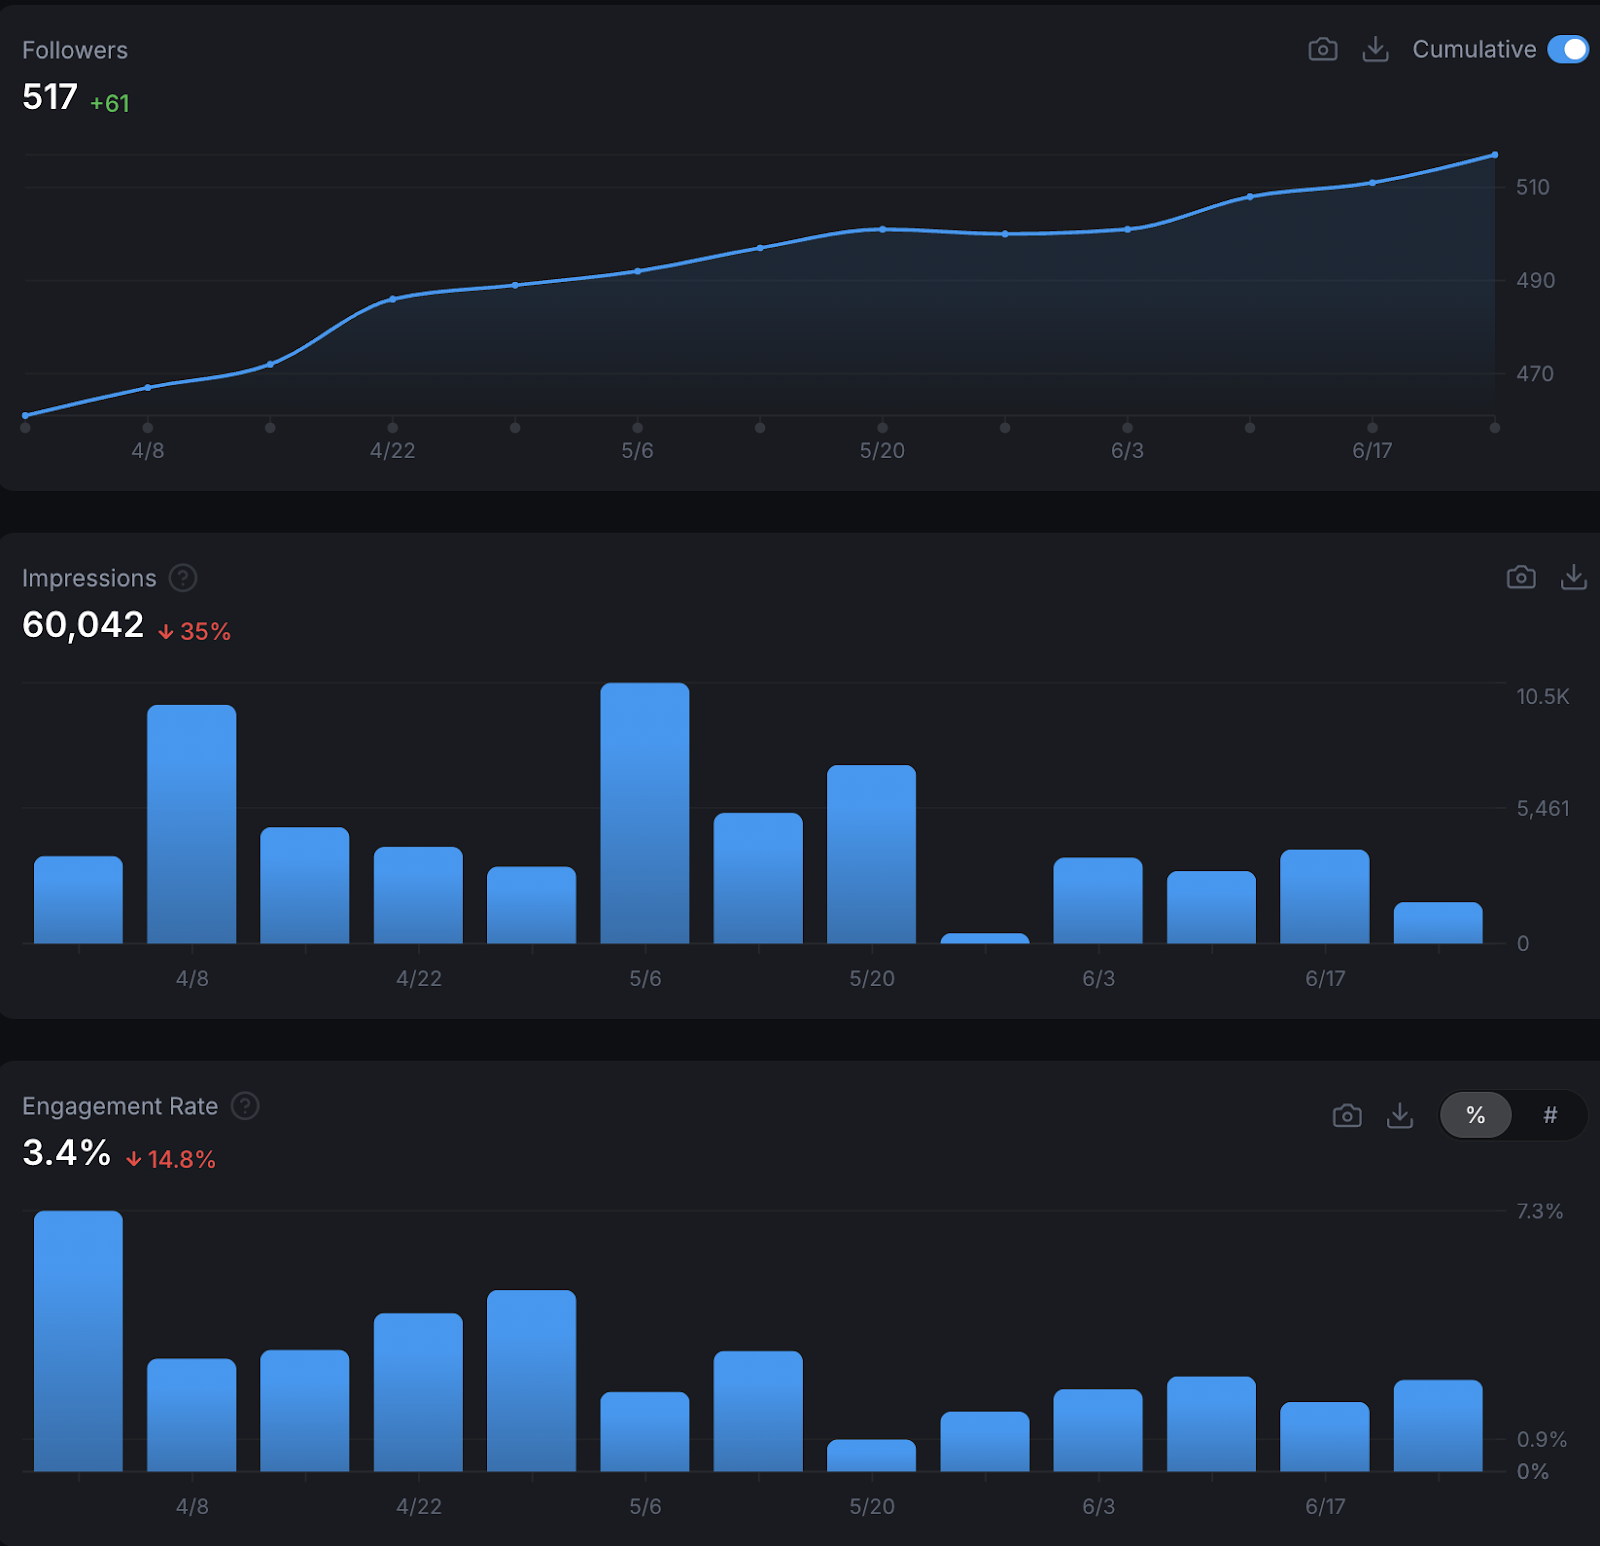
Summary: This quarter showed a minor decline in most metrics, except for follower count, which increased. Post frequency remained consistent with the previous quarter. Content highlighting yield opportunities proved most effective for the eUSD account. The growth in followers is encouraging, but the decrease in impressions likely stems from the absence of viral content, unlike last quarter when several posts gained significant traction.
Conclusion:
That concludes the Q2 2025 report. Comment below any questions and comments you might have and make sure to stay up to date on all things eUSD by following the X account here:
Disclaimer: This is everything that happened, a celebration of the community and an invitation to participate in the ongoing success of eUSD. Continue to participate in the gov ops call, continue to participate on the forums and in onchain votes.
eUSD: created on the Reserve Yield Protocol ![]()